|
Download Data (XLS File) |
|
||||||||
|
||||||||
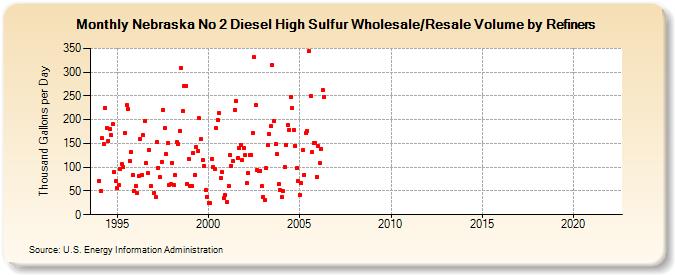
| Nebraska No 2 Diesel High Sulfur Wholesale/Resale Volume by Refiners (Thousand Gallons per Day) | ||||||||
| Year | Jan | Feb | Mar | Apr | May | Jun | Jul | Aug | Sep | Oct | Nov | Dec |
|---|---|---|---|---|---|---|---|---|---|---|---|---|
| 1994 | 71.6 | 49.1 | 160.8 | 148.7 | 225.4 | 183.2 | 155.6 | 181.3 | 166.8 | 190.1 | 89.5 | 70.4 |
| 1995 | 56.0 | 62.3 | 96.4 | 105.9 | 100.0 | 172.3 | 230.0 | 221.9 | 113.1 | 132.2 | 84.0 | 50.9 |
| 1996 | 60.4 | 45.0 | 81.7 | 158.3 | 84.2 | 166.9 | 196.6 | 108.4 | 87.0 | 137.0 | 60.2 | W |
| 1997 | 45.3 | 37.2 | 152.6 | 99.0 | 79.0 | 111.5 | 220.3 | 181.9 | 127.5 | 150.2 | 63.2 | 64.5 |
| 1998 | 109.4 | 63.5 | 83.2 | 152.4 | 149.3 | 176.2 | 309.4 | 217.7 | 270.4 | 270.4 | 64.9 | 118.1 |
| 1999 | 60.2 | 61.4 | 130.0 | 83.9 | 142.1 | 133.6 | 202.5 | 158.5 | 114.2 | 102.4 | 51.9 | 38.0 |
| 2000 | 25.2 | 24.4 | 117.4 | 100.1 | 95.9 | 181.6 | 199.1 | 213.4 | 78.1 | 89.5 | 34.9 | 40.7 |
| 2001 | 26.1 | 61.4 | 125.8 | 103.1 | 112.0 | 221.3 | 239.0 | 119.6 | 139.8 | 146.3 | 114.1 | 140.5 |
| 2002 | 124.7 | 66.5 | 87.6 | 126.1 | 126.2 | 172.1 | 331.7 | 231.2 | 94.4 | 92.6 | 93.0 | 59.7 |
| 2003 | 37.3 | 32.0 | 97.4 | 146.4 | 169.3 | 185.7 | 314.2 | 197.2 | 148.8 | 126.9 | 63.9 | 51.9 |
| 2004 | 36.9 | 49.2 | 100.3 | 147.3 | 189.0 | 179.3 | 246.8 | 223.9 | 178.6 | 144.6 | 97.6 | 70.0 |
| 2005 | 41.5 | 65.7 | 135.9 | 84.4 | 171.6 | 175.7 | 344.4 | 248.8 | 131.3 | 150.0 | 151.1 | 80.1 |
| 2006 | 144.1 | 109.1 | 138.9 | 262.1 | 247.2 | W | - | - | - | W | - | - |
| 2007 | - | - | - | - | - | W | W | - | - | - | - | - |
| 2008 | - | - | - | - | - | - | - | - | - | - | - | - |
| 2009 | - | - | - | - | - | - | - | - | - | - | - | - |
| 2010 | - | - | - | - | - | - | - | - | - | - | - | - |
| 2011 | - | - | - | - | - | - | - | - | - | - | - | - |
| 2012 | - | - | - | - | - | - | - | - | - | - | - | - |
| 2013 | - | - | - | - | - | - | - | - | - | - | - | - |
| 2014 | - | - | - | - | - | - | - | - | - | - | - | - |
| 2015 | - | - | - | - | - | - | - | - | - | - | - | - |
| 2016 | - | - | - | - | - | - | - | - | - | - | - | - |
| 2017 | - | - | - | - | - | - | - | - | - | - | - | - |
| 2018 | - | - | - | - | - | - | - | - | - | - | - | - |
| 2019 | - | - | - | - | - | - | - | - | - | - | - | - |
| 2020 | - | - | - | - | - | - | - | - | - | - | - | - |
| 2021 | - | - | - | - | - | - | - | - | - | - | - | - |
| 2022 | - | - | - | |||||||||
| - = No Data Reported; -- = Not Applicable; NA = Not Available; W = Withheld to avoid disclosure of individual company data. |
| Release Date: 6/1/2022 |
| Next Release Date: TBD |