|
Download Data (XLS File) |
|
||||||||
|
||||||||
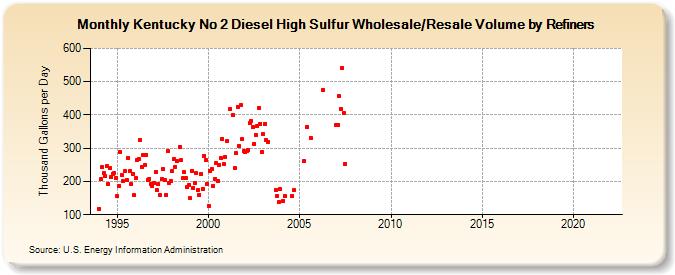
| Kentucky No 2 Diesel High Sulfur Wholesale/Resale Volume by Refiners (Thousand Gallons per Day) | ||||||||
| Year | Jan | Feb | Mar | Apr | May | Jun | Jul | Aug | Sep | Oct | Nov | Dec |
|---|---|---|---|---|---|---|---|---|---|---|---|---|
| 1994 | 118.5 | 206.2 | 242.6 | 224.6 | 216.8 | 245.7 | 193.7 | 240.7 | 212.7 | 222.8 | 226.0 | 211.0 |
| 1995 | 155.3 | 187.1 | 288.1 | 219.4 | 200.4 | 230.6 | 203.5 | 270.9 | 231.3 | 191.4 | 223.2 | 158.1 |
| 1996 | 210.9 | 264.7 | 267.2 | 324.4 | 244.0 | 279.4 | 248.2 | 280.8 | 203.6 | 208.4 | 192.6 | 187.3 |
| 1997 | 194.6 | 228.2 | 172.8 | 191.0 | 158.4 | 207.3 | 236.3 | 204.5 | 160.7 | 290.6 | 196.2 | 201.5 |
| 1998 | 231.5 | 268.1 | 244.1 | 262.0 | W | 304.8 | 264.0 | 209.4 | 228.0 | 210.1 | 184.8 | 188.8 |
| 1999 | 149.0 | 232.9 | 181.8 | 195.5 | 223.9 | 175.6 | 159.4 | 222.8 | 177.6 | 277.4 | 264.3 | 191.7 |
| 2000 | 126.7 | 231.9 | 238.1 | 186.8 | 208.8 | 254.7 | 201.7 | 250.9 | 270.0 | 328.5 | 251.3 | 273.4 |
| 2001 | 320.2 | W | 417.3 | W | 398.5 | 240.1 | 284.2 | 424.9 | 307.1 | 429.7 | 327.3 | 290.9 |
| 2002 | 289.5 | 290.4 | 293.1 | 374.7 | 381.5 | 362.9 | 313.9 | 339.6 | 367.3 | 421.8 | 373.9 | 289.6 |
| 2003 | 342.5 | 373.5 | 323.9 | 319.7 | W | W | W | W | 174.4 | 157.0 | 137.0 | 177.6 |
| 2004 | W | 142.7 | 156.9 | W | W | W | W | 155.7 | 173.1 | W | W | W |
| 2005 | W | W | W | 261.1 | W | 364.4 | W | 330.9 | W | W | W | W |
| 2006 | W | W | W | 475.9 | W | W | W | W | W | W | W | W |
| 2007 | 369.2 | 370.3 | 455.4 | 419.1 | 541.5 | 407.0 | 253.3 | W | W | W | W | W |
| 2008 | W | W | W | - | W | W | W | W | - | - | - | - |
| 2009 | - | - | - | - | - | - | W | W | W | W | W | W |
| 2010 | W | W | - | - | - | - | - | - | - | - | - | - |
| 2011 | - | - | - | - | - | - | - | - | - | - | - | - |
| 2012 | - | - | - | - | - | - | - | - | - | - | - | - |
| 2013 | - | - | - | - | - | - | - | - | - | - | - | - |
| 2014 | - | - | - | - | - | - | - | - | - | - | - | - |
| 2015 | - | - | - | - | - | - | - | - | - | - | - | - |
| 2016 | - | - | - | - | - | - | - | - | - | - | - | - |
| 2017 | - | - | - | - | - | - | - | - | - | - | - | - |
| 2018 | - | - | - | - | - | - | - | - | - | - | - | - |
| 2019 | - | - | - | - | - | - | - | - | - | - | - | - |
| 2020 | - | - | - | - | - | - | - | - | - | - | - | - |
| 2021 | - | - | - | - | - | - | - | - | - | - | - | - |
| 2022 | - | - | - | |||||||||
| - = No Data Reported; -- = Not Applicable; NA = Not Available; W = Withheld to avoid disclosure of individual company data. |
| Release Date: 6/1/2022 |
| Next Release Date: TBD |