|
Download Data (XLS File) |
|
||||||||
|
||||||||
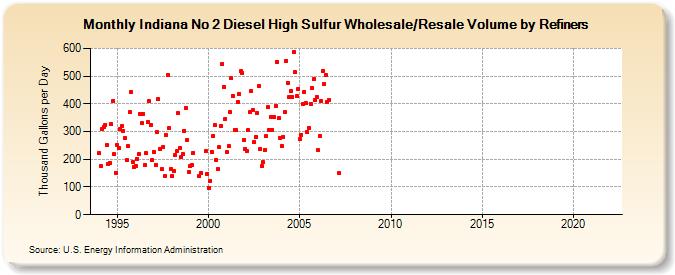
| Indiana No 2 Diesel High Sulfur Wholesale/Resale Volume by Refiners (Thousand Gallons per Day) | ||||||||
| Year | Jan | Feb | Mar | Apr | May | Jun | Jul | Aug | Sep | Oct | Nov | Dec |
|---|---|---|---|---|---|---|---|---|---|---|---|---|
| 1994 | 221.9 | 174.3 | 310.2 | 316.7 | 324.2 | 249.7 | 184.5 | 188.0 | 326.6 | 409.8 | 217.4 | 151.6 |
| 1995 | 251.3 | 242.0 | 310.2 | 319.4 | 303.0 | 276.0 | 195.6 | 247.4 | 370.4 | 444.3 | 189.1 | 170.9 |
| 1996 | 176.6 | 201.9 | 218.5 | 364.4 | 330.7 | 365.1 | 180.8 | 221.7 | 334.0 | 410.1 | 324.4 | 197.4 |
| 1997 | 227.3 | 179.8 | 297.5 | 417.1 | 235.6 | 165.2 | 244.6 | 138.2 | 288.0 | 502.9 | 312.1 | 163.2 |
| 1998 | 140.1 | 159.1 | 216.0 | 228.3 | 365.6 | 239.8 | 207.1 | 219.0 | 303.1 | 386.0 | 270.8 | 153.9 |
| 1999 | 174.3 | 178.9 | 223.0 | NA | W | NA | 138.8 | 151.5 | NA | NA | 228.2 | 148.5 |
| 2000 | 97.5 | 121.8 | 227.3 | 285.7 | 323.5 | 197.4 | 164.7 | 242.7 | 320.5 | 545.4 | 461.6 | 346.3 |
| 2001 | 225.3 | 246.5 | 369.8 | 491.8 | 427.8 | 305.7 | 304.3 | 408.0 | 436.3 | 517.5 | 512.8 | 270.5 |
| 2002 | 238.3 | 231.1 | 304.2 | 369.6 | 446.7 | 376.0 | 262.0 | 281.4 | 368.1 | 463.4 | 238.4 | 175.4 |
| 2003 | 188.6 | 234.8 | 283.8 | 388.2 | 306.8 | 352.4 | 306.3 | 352.0 | 393.9 | 552.1 | 347.5 | 277.7 |
| 2004 | 248.9 | 280.8 | 369.7 | 554.7 | 476.4 | 424.2 | 445.1 | 425.5 | 588.3 | 513.8 | 426.9 | 454.0 |
| 2005 | 273.2 | 288.0 | 399.6 | 442.8 | 401.3 | 297.7 | 314.4 | 400.9 | 458.6 | 489.5 | 414.0 | 423.9 |
| 2006 | 232.0 | 284.6 | 409.3 | 518.3 | 470.6 | 503.6 | 407.3 | 413.9 | W | W | W | W |
| 2007 | W | W | 149.4 | W | W | W | W | W | W | W | - | - |
| 2008 | - | - | - | - | - | - | - | - | - | - | - | - |
| 2009 | - | - | - | - | - | - | - | - | - | - | - | - |
| 2010 | - | - | - | - | - | - | - | - | - | - | - | - |
| 2011 | - | - | - | - | - | - | - | - | - | - | - | - |
| 2012 | - | - | - | - | - | - | - | - | - | - | - | - |
| 2013 | - | - | - | - | - | - | - | - | - | - | - | - |
| 2014 | - | - | - | - | - | - | - | - | - | - | - | - |
| 2015 | - | - | - | - | - | - | - | - | - | - | - | - |
| 2016 | - | - | - | - | - | - | - | - | - | - | - | - |
| 2017 | - | - | - | - | - | - | - | - | - | - | - | - |
| 2018 | - | - | - | - | - | - | - | - | - | - | - | - |
| 2019 | - | - | - | - | - | - | - | - | - | - | - | - |
| 2020 | - | - | - | - | - | - | - | - | - | - | - | - |
| 2021 | - | - | - | - | - | - | - | - | - | - | - | - |
| 2022 | - | - | - | |||||||||
| - = No Data Reported; -- = Not Applicable; NA = Not Available; W = Withheld to avoid disclosure of individual company data. |
| Release Date: 6/1/2022 |
| Next Release Date: TBD |