|
Download Data (XLS File) |
|
||||||||
|
||||||||
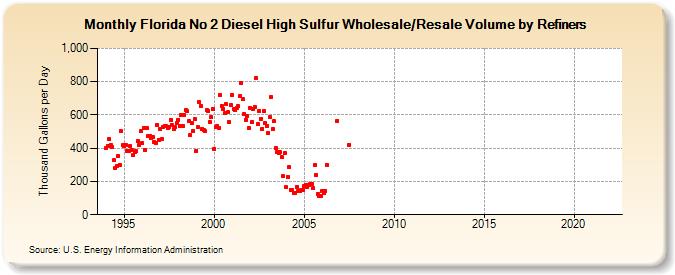
| Florida No 2 Diesel High Sulfur Wholesale/Resale Volume by Refiners (Thousand Gallons per Day) | ||||||||
| Year | Jan | Feb | Mar | Apr | May | Jun | Jul | Aug | Sep | Oct | Nov | Dec |
|---|---|---|---|---|---|---|---|---|---|---|---|---|
| 1994 | 399.9 | 415.0 | 453.7 | 419.8 | 407.2 | 326.0 | 279.7 | 295.4 | 353.1 | 299.6 | 502.5 | 417.5 |
| 1995 | 414.7 | 419.5 | 384.6 | 384.4 | 412.6 | 387.0 | 357.1 | 377.0 | 381.2 | 442.1 | 419.6 | 501.9 |
| 1996 | 428.2 | 519.7 | 389.9 | 522.9 | 475.7 | 476.2 | 460.8 | 468.4 | 437.6 | 432.9 | 541.2 | 452.1 |
| 1997 | 516.8 | 455.4 | 528.0 | 536.0 | 531.2 | 520.0 | 526.1 | 572.4 | 537.9 | 513.6 | 525.7 | 551.2 |
| 1998 | 571.0 | 530.7 | 596.9 | 536.1 | 597.9 | 629.0 | 621.2 | 562.1 | 477.3 | 549.9 | 503.9 | 572.6 |
| 1999 | 384.9 | 528.5 | 677.1 | 655.7 | 518.1 | 508.4 | 501.4 | 629.6 | 625.2 | 560.2 | 585.5 | 635.9 |
| 2000 | 397.7 | 525.1 | 534.5 | 519.6 | 720.6 | 656.3 | 637.5 | 610.6 | 665.5 | 615.2 | 555.2 | 660.4 |
| 2001 | 721.7 | 635.0 | 627.9 | 642.8 | 650.7 | 712.1 | 793.8 | 695.7 | 604.5 | 571.4 | 594.5 | 523.8 |
| 2002 | 644.3 | 554.8 | 637.3 | 646.7 | 822.5 | 542.5 | 622.6 | 577.7 | 517.2 | 621.9 | 551.3 | 532.5 |
| 2003 | 493.5 | 586.8 | 707.9 | 515.0 | 561.5 | 399.3 | 379.8 | 369.6 | 374.1 | 347.6 | 230.9 | 371.6 |
| 2004 | 164.5 | 228.8 | 285.6 | 149.9 | 148.3 | 129.9 | 133.5 | 166.9 | 139.7 | 143.1 | 146.2 | 149.6 |
| 2005 | 171.2 | 181.5 | 164.1 | 177.4 | 183.1 | 181.7 | 159.6 | 298.5 | 239.8 | 126.3 | 114.3 | 111.6 |
| 2006 | 142.8 | 130.4 | 142.9 | 301.6 | W | W | W | W | W | W | 563.8 | W |
| 2007 | W | W | W | W | W | W | 421.7 | W | W | W | - | - |
| 2008 | - | - | - | - | - | - | - | - | - | - | - | - |
| 2009 | - | - | - | - | - | - | - | - | - | - | - | - |
| 2010 | - | - | - | - | - | - | - | - | - | - | - | - |
| 2011 | - | - | - | - | - | - | - | - | - | - | - | - |
| 2012 | - | - | - | - | - | - | - | - | - | - | - | - |
| 2013 | - | - | - | - | - | - | - | - | - | - | - | - |
| 2014 | - | - | - | - | - | - | - | - | - | - | - | - |
| 2015 | - | - | - | - | - | - | - | - | - | - | - | - |
| 2016 | - | - | - | - | - | - | - | - | - | - | - | - |
| 2017 | - | - | - | - | - | - | - | - | - | - | - | - |
| 2018 | - | - | - | - | - | - | - | - | - | - | - | - |
| 2019 | - | - | - | - | - | - | - | - | - | - | - | - |
| 2020 | - | - | - | - | - | - | - | - | - | - | - | - |
| 2021 | - | - | - | - | - | - | - | - | - | - | - | - |
| 2022 | - | - | - | |||||||||
| - = No Data Reported; -- = Not Applicable; NA = Not Available; W = Withheld to avoid disclosure of individual company data. |
| Release Date: 6/1/2022 |
| Next Release Date: TBD |