|
Download Data (XLS File) |
|
||||||||
|
||||||||
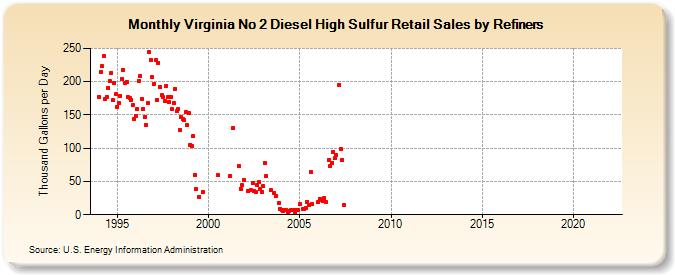
| Virginia No 2 Diesel High Sulfur Retail Sales by Refiners (Thousand Gallons per Day) | ||||||||
| Year | Jan | Feb | Mar | Apr | May | Jun | Jul | Aug | Sep | Oct | Nov | Dec |
|---|---|---|---|---|---|---|---|---|---|---|---|---|
| 1994 | 177.6 | 214.3 | 223.4 | 238.3 | 174.3 | 177.1 | 191.1 | 201.2 | 212.7 | 171.8 | 198.2 | 180.7 |
| 1995 | 162.5 | 167.4 | 179.0 | 204.1 | 217.2 | 198.4 | 199.9 | 177.0 | 175.5 | 173.1 | 164.5 | 144.0 |
| 1996 | 148.9 | 159.3 | 201.7 | 208.5 | 174.5 | 158.8 | 147.5 | 134.7 | 167.2 | 244.1 | 232.8 | 206.5 |
| 1997 | 197.0 | 232.0 | 172.6 | 228.6 | 192.4 | 179.2 | 177.0 | 170.8 | 193.6 | 176.5 | 169.9 | 176.6 |
| 1998 | 158.8 | 168.6 | 189.4 | 155.3 | 159.0 | 127.0 | 147.6 | 143.7 | 141.9 | 154.4 | 134.4 | 152.6 |
| 1999 | 105.3 | 102.6 | 117.7 | 60.2 | 38.3 | W | 26.8 | W | 33.5 | W | W | W |
| 2000 | W | W | W | W | W | W | 59.2 | W | W | W | W | W |
| 2001 | W | W | 58.3 | W | 130.5 | W | W | W | 73.1 | 39.4 | 44.1 | 52.3 |
| 2002 | W | W | 35.2 | W | 36.7 | 47.0 | 36.3 | 34.5 | 44.2 | 49.2 | 39.4 | 34.4 |
| 2003 | 42.7 | 77.5 | 57.7 | W | W | 36.7 | W | 33.1 | 27.9 | NA | 17.3 | 9.3 |
| 2004 | 7.5 | 6.3 | 7.1 | 7.1 | 3.8 | 5.9 | 7.3 | W | 6.5 | 3.8 | 7.6 | 6.5 |
| 2005 | 16.3 | W | 8.6 | 8.2 | 10.2 | 19.4 | 14.2 | 64.1 | 15.6 | W | W | W |
| 2006 | 18.5 | 23.9 | 21.9 | 20.0 | 25.3 | 19.0 | W | 82.7 | 73.4 | 78.4 | 94.0 | 84.7 |
| 2007 | 89.4 | W | 195.5 | 99.0 | 82.5 | 14.9 | W | W | W | W | W | W |
| 2008 | W | - | - | - | - | - | - | - | - | - | - | - |
| 2009 | - | - | - | - | - | - | - | - | - | - | - | - |
| 2010 | - | - | - | - | - | - | - | - | - | - | - | - |
| 2011 | - | - | - | - | - | - | - | - | - | - | - | - |
| 2012 | - | - | - | - | - | - | - | - | - | - | - | - |
| 2013 | - | - | - | - | - | - | - | - | - | - | - | - |
| 2014 | - | - | - | - | - | - | - | - | - | - | - | - |
| 2015 | - | - | - | - | - | - | - | - | - | - | - | - |
| 2016 | - | - | - | - | - | - | - | - | - | - | - | - |
| 2017 | - | - | - | - | - | - | - | - | - | - | - | - |
| 2018 | - | - | - | - | - | - | - | - | - | - | - | - |
| 2019 | - | - | - | - | - | - | - | - | - | - | - | - |
| 2020 | - | - | - | - | - | - | - | - | - | - | - | - |
| 2021 | - | - | - | - | - | - | - | - | - | - | - | - |
| 2022 | - | - | - | |||||||||
| - = No Data Reported; -- = Not Applicable; NA = Not Available; W = Withheld to avoid disclosure of individual company data. |
| Release Date: 6/1/2022 |
| Next Release Date: TBD |