|
Download Data (XLS File) |
|
||||||||
|
||||||||
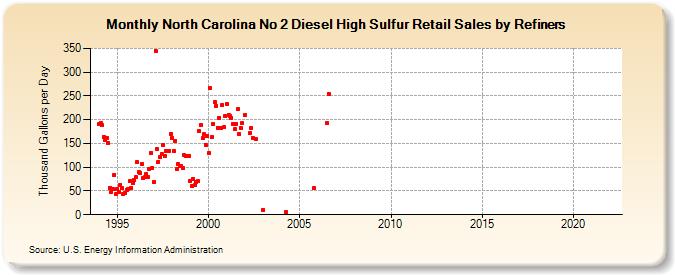
| North Carolina No 2 Diesel High Sulfur Retail Sales by Refiners (Thousand Gallons per Day) | ||||||||
| Year | Jan | Feb | Mar | Apr | May | Jun | Jul | Aug | Sep | Oct | Nov | Dec |
|---|---|---|---|---|---|---|---|---|---|---|---|---|
| 1994 | 190.4 | 193.3 | 188.5 | 164.4 | 157.3 | 161.5 | 150.8 | 56.9 | 47.9 | 54.5 | 84.1 | 42.7 |
| 1995 | 54.0 | 48.3 | 63.1 | 55.8 | 42.8 | 46.7 | 52.4 | 53.2 | 70.0 | 57.0 | 66.9 | 73.5 |
| 1996 | 79.0 | 110.2 | 89.0 | 87.4 | 107.5 | 76.7 | 78.4 | 85.5 | 79.5 | 95.7 | 130.3 | 99.0 |
| 1997 | 68.9 | 345.5 | 138.3 | 111.7 | 121.5 | 127.6 | 146.3 | 124.6 | 133.5 | 134.6 | 135.1 | 169.7 |
| 1998 | 161.7 | 134.2 | 156.1 | 95.5 | 106.3 | 101.5 | 102.9 | 98.1 | 125.0 | 123.5 | 124.4 | 124.2 |
| 1999 | 71.5 | 60.5 | 75.1 | 62.7 | 69.4 | 70.2 | 175.6 | 188.6 | 161.0 | 169.2 | 146.9 | 166.3 |
| 2000 | 129.5 | 266.3 | 163.0 | 191.5 | 236.2 | 229.0 | 183.3 | 203.8 | 181.5 | 230.4 | 184.0 | 206.9 |
| 2001 | 232.0 | 210.1 | 208.2 | 204.4 | 191.4 | 179.6 | 191.0 | 222.3 | 170.0 | 183.5 | 192.2 | W |
| 2002 | 210.2 | W | W | 171.4 | 182.7 | 161.4 | W | 158.5 | W | W | W | W |
| 2003 | 10.0 | W | W | W | W | W | W | W | W | W | W | W |
| 2004 | W | W | W | 6.3 | W | W | W | W | W | W | W | W |
| 2005 | W | W | W | W | W | W | W | W | W | 55.2 | W | W |
| 2006 | W | W | W | W | W | W | 192.9 | 254.2 | W | W | W | W |
| 2007 | W | W | W | W | W | W | W | W | W | W | - | - |
| 2008 | - | - | - | - | - | - | - | - | - | - | - | - |
| 2009 | - | - | - | - | - | - | - | - | - | - | - | - |
| 2010 | - | - | - | - | - | - | - | - | - | - | - | - |
| 2011 | - | - | - | - | - | - | - | - | - | - | - | - |
| 2012 | - | - | - | - | - | - | - | - | - | - | - | - |
| 2013 | - | - | - | - | - | - | - | - | - | - | - | - |
| 2014 | - | - | - | - | - | - | - | - | - | - | - | - |
| 2015 | - | - | - | - | - | - | - | - | - | - | - | - |
| 2016 | - | - | - | - | - | - | - | - | - | - | - | - |
| 2017 | - | - | - | - | - | - | - | - | - | - | - | - |
| 2018 | - | - | - | - | - | - | - | - | - | - | - | - |
| 2019 | - | - | - | - | - | - | - | - | - | - | - | - |
| 2020 | - | - | - | - | - | - | - | - | - | - | - | - |
| 2021 | - | - | - | - | - | - | - | - | - | - | - | - |
| 2022 | - | - | - | |||||||||
| - = No Data Reported; -- = Not Applicable; NA = Not Available; W = Withheld to avoid disclosure of individual company data. |
| Release Date: 6/1/2022 |
| Next Release Date: TBD |