|
Download Data (XLS File) |
|
||||||||
|
||||||||
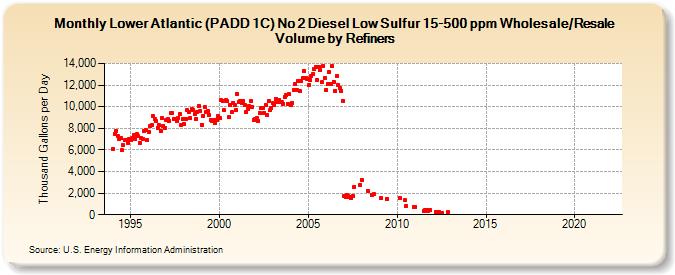
| Lower Atlantic (PADD 1C) No 2 Diesel Low Sulfur 15-500 ppm Wholesale/Resale Volume by Refiners (Thousand Gallons per Day) | ||||||||
| Year | Jan | Feb | Mar | Apr | May | Jun | Jul | Aug | Sep | Oct | Nov | Dec |
|---|---|---|---|---|---|---|---|---|---|---|---|---|
| 1994 | 6,116.2 | 7,514.8 | 7,738.8 | 7,329.7 | 6,973.1 | 7,115.2 | 5,952.5 | 6,424.1 | 6,890.1 | 6,946.0 | 6,648.8 | 6,965.5 |
| 1995 | 6,892.9 | 7,143.9 | 7,401.1 | 6,978.6 | 7,429.8 | 7,286.3 | 6,663.5 | 7,071.3 | 7,047.7 | 7,779.2 | 7,802.7 | 6,899.8 |
| 1996 | 7,674.6 | 8,205.7 | 8,342.1 | 9,139.5 | 8,862.9 | 8,667.0 | 8,049.2 | 8,270.8 | 7,784.9 | 8,954.0 | 8,248.0 | 8,069.1 |
| 1997 | 8,813.2 | 8,899.0 | 8,717.6 | 9,375.6 | 9,394.0 | 8,887.7 | 8,855.5 | 8,670.5 | 8,978.1 | 9,302.8 | 8,335.3 | 8,820.0 |
| 1998 | 8,426.0 | 8,872.9 | 9,666.9 | 9,499.9 | 8,918.0 | 9,827.5 | 9,673.2 | 9,281.5 | 8,864.5 | 9,535.4 | 10,072.6 | 9,597.5 |
| 1999 | 8,331.5 | 9,143.0 | 9,947.9 | 9,527.4 | 9,595.5 | 9,236.5 | 8,796.2 | 8,678.9 | 8,802.3 | 8,450.6 | 8,722.6 | 9,125.2 |
| 2000 | 8,938.9 | 10,594.7 | 10,557.5 | 9,668.4 | 10,584.5 | 10,494.0 | 9,021.5 | 10,150.1 | 9,486.0 | 10,355.9 | 10,132.4 | 9,731.4 |
| 2001 | 11,193.0 | 10,421.2 | 10,569.3 | 10,347.6 | 10,548.8 | 10,147.2 | 9,538.6 | 9,785.5 | 10,019.0 | 10,520.8 | 9,977.4 | 8,795.9 |
| 2002 | 8,865.9 | 8,958.5 | 8,701.4 | 9,444.7 | 9,865.7 | 9,839.5 | 9,428.1 | 10,165.8 | 9,237.5 | 10,539.2 | 9,677.3 | 9,870.1 |
| 2003 | 10,303.8 | 10,140.7 | 10,755.9 | 10,444.3 | 10,627.1 | 10,458.0 | 10,401.9 | 10,278.3 | 10,904.8 | 11,054.6 | 10,251.3 | 11,154.7 |
| 2004 | 10,178.7 | 10,385.5 | 11,518.7 | 12,106.2 | 11,519.6 | 12,381.1 | 11,449.5 | 12,341.3 | 12,652.0 | 13,273.5 | 12,675.5 | 12,588.7 |
| 2005 | 11,984.0 | 12,452.4 | 12,863.1 | 12,982.0 | 13,448.7 | 13,704.0 | 12,472.5 | 13,710.9 | 13,380.7 | 12,262.2 | 13,787.1 | 12,696.8 |
| 2006 | 11,576.5 | 12,084.8 | 13,210.2 | 12,134.1 | 13,781.4 | 12,320.1 | 11,464.8 | 12,851.4 | 12,052.0 | 11,734.1 | 11,453.8 | 10,546.9 |
| 2007 | 1,689.6 | 1,598.7 | 1,820.0 | 1,715.9 | 1,635.2 | 1,516.5 | 1,715.7 | 2,578.9 | W | W | W | 2,750.6 |
| 2008 | 3,218.0 | W | W | W | 2,212.4 | W | W | 1,858.9 | 1,914.2 | W | W | W |
| 2009 | W | 1,515.9 | W | W | W | 1,479.6 | W | W | W | W | W | W |
| 2010 | W | W | 1,536.3 | NA | W | 1,316.9 | 820.5 | W | W | W | W | 739.4 |
| 2011 | 757.9 | W | NA | NA | W | W | 387.5 | 436.0 | 432.3 | 371.8 | 435.5 | W |
| 2012 | W | W | 293.2 | 292.3 | 281.3 | W | 183.3 | W | W | W | 239.4 | W |
| 2013 | W | W | W | W | W | W | W | W | W | W | W | W |
| 2014 | W | W | W | W | W | - | - | - | - | - | - | - |
| 2015 | - | - | - | - | - | - | - | - | - | - | - | - |
| 2016 | - | - | - | - | - | - | - | - | - | - | - | - |
| 2017 | - | - | - | - | - | - | - | - | - | - | - | - |
| 2018 | - | - | - | W | - | - | - | - | W | - | - | - |
| 2019 | - | - | - | - | - | - | - | - | - | - | - | - |
| 2020 | - | - | - | - | - | - | - | - | - | - | - | - |
| 2021 | - | - | - | - | - | - | - | - | - | - | - | - |
| 2022 | - | - | - | |||||||||
| - = No Data Reported; -- = Not Applicable; NA = Not Available; W = Withheld to avoid disclosure of individual company data. |
| Release Date: 6/1/2022 |
| Next Release Date: TBD |