|
Download Data (XLS File) |
|
||||||||
|
||||||||
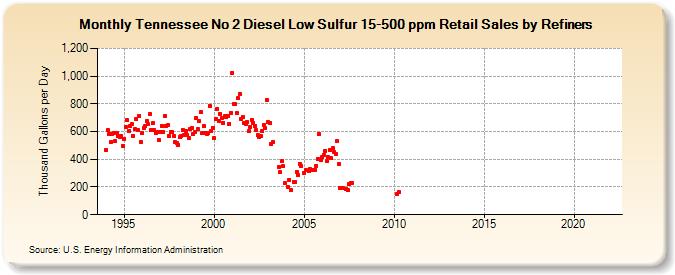
| Tennessee No 2 Diesel Low Sulfur 15-500 ppm Retail Sales by Refiners (Thousand Gallons per Day) | ||||||||
| Year | Jan | Feb | Mar | Apr | May | Jun | Jul | Aug | Sep | Oct | Nov | Dec |
|---|---|---|---|---|---|---|---|---|---|---|---|---|
| 1994 | 469.2 | 608.5 | 582.7 | 524.1 | 585.6 | 591.3 | 528.5 | 591.4 | 564.6 | 558.0 | 564.9 | 495.9 |
| 1995 | 549.4 | 633.2 | 681.2 | 603.4 | 637.6 | 651.9 | 569.9 | 616.6 | 688.6 | 614.7 | 713.3 | 521.6 |
| 1996 | 586.6 | 625.0 | 637.6 | 674.3 | 653.4 | 725.4 | 610.9 | 660.7 | 610.5 | 592.4 | 598.9 | 539.6 |
| 1997 | 596.4 | 642.6 | 599.0 | 713.7 | 637.2 | 644.5 | 570.4 | 597.5 | 595.8 | 567.1 | 523.0 | 518.6 |
| 1998 | 506.3 | 559.1 | 566.9 | 612.5 | 577.5 | 604.7 | 574.8 | 552.5 | 616.3 | 626.9 | 579.2 | 597.2 |
| 1999 | 698.1 | 619.0 | 675.7 | 741.4 | 590.4 | 638.5 | 588.1 | 583.2 | 592.7 | 787.6 | 601.2 | 628.6 |
| 2000 | 553.3 | 691.1 | 766.2 | 678.3 | 728.4 | 698.4 | 664.4 | 711.3 | 705.0 | 714.7 | 657.1 | 735.8 |
| 2001 | 1,025.2 | 798.8 | 796.0 | 731.5 | 839.4 | 871.0 | 690.9 | 705.1 | 664.2 | 657.5 | 668.9 | 601.5 |
| 2002 | 635.6 | 685.7 | 663.3 | 637.9 | 608.9 | 571.7 | 557.3 | 571.5 | 603.4 | 645.6 | 624.9 | 829.9 |
| 2003 | 668.3 | 664.8 | 509.3 | 524.0 | NA | W | W | 347.2 | 305.7 | 384.3 | 348.4 | 226.6 |
| 2004 | W | 202.6 | 253.6 | 181.4 | W | 235.8 | 238.2 | 310.6 | 287.8 | 367.6 | 349.9 | W |
| 2005 | 302.5 | 320.3 | W | 314.0 | 326.7 | 319.7 | 319.8 | 326.0 | 352.5 | 402.3 | 584.0 | 395.3 |
| 2006 | 417.8 | 432.9 | 461.8 | 390.1 | 414.5 | 470.4 | 405.7 | 481.1 | 449.9 | 441.4 | 528.4 | 369.0 |
| 2007 | 193.6 | W | 189.7 | W | 188.6 | 179.9 | 220.3 | 228.1 | 228.0 | W | W | W |
| 2008 | W | W | W | W | W | W | W | W | W | W | W | W |
| 2009 | W | W | W | W | W | W | W | W | W | W | W | W |
| 2010 | W | W | 152.6 | 162.4 | NA | NA | W | W | W | W | W | W |
| 2011 | W | W | W | W | W | W | W | W | W | W | W | W |
| 2012 | W | W | W | W | W | W | W | W | W | W | W | W |
| 2013 | W | W | W | W | W | W | W | W | W | W | W | W |
| 2014 | W | W | W | W | W | W | W | - | - | - | - | - |
| 2015 | - | - | - | - | - | - | - | - | - | - | - | - |
| 2016 | - | - | - | - | - | - | - | - | - | - | - | - |
| 2017 | - | - | - | - | - | - | - | - | - | - | - | - |
| 2018 | - | - | - | - | - | - | - | - | - | - | - | - |
| 2019 | - | - | - | - | - | - | - | - | - | - | - | - |
| 2020 | - | - | - | - | - | - | - | - | - | - | - | - |
| 2021 | - | - | - | - | - | - | - | - | - | - | - | - |
| 2022 | - | - | - | |||||||||
| - = No Data Reported; -- = Not Applicable; NA = Not Available; W = Withheld to avoid disclosure of individual company data. |
| Release Date: 6/1/2022 |
| Next Release Date: TBD |