|
Download Data (XLS File) |
|
||||||||
|
||||||||
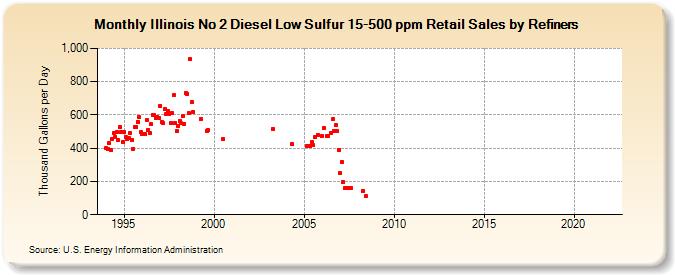
| Illinois No 2 Diesel Low Sulfur 15-500 ppm Retail Sales by Refiners (Thousand Gallons per Day) | ||||||||
| Year | Jan | Feb | Mar | Apr | May | Jun | Jul | Aug | Sep | Oct | Nov | Dec |
|---|---|---|---|---|---|---|---|---|---|---|---|---|
| 1994 | 398.3 | 394.0 | 429.5 | 389.1 | 456.5 | 490.5 | 470.0 | 495.5 | 447.3 | 527.3 | 497.3 | 438.3 |
| 1995 | 495.1 | 467.2 | 453.4 | 460.6 | 490.7 | 452.2 | 397.9 | 529.5 | 528.8 | 560.2 | 585.0 | 495.1 |
| 1996 | 482.8 | W | 485.0 | 566.7 | 509.5 | 492.0 | 542.7 | 598.1 | 597.7 | 580.7 | 589.4 | 581.6 |
| 1997 | 656.3 | 558.5 | 552.5 | 633.3 | 603.2 | 625.2 | 603.5 | 553.5 | 611.5 | 717.0 | 550.5 | 502.8 |
| 1998 | 535.0 | 566.1 | 548.8 | 592.7 | 545.5 | 732.4 | 727.8 | 609.8 | 936.1 | 676.9 | 618.0 | W |
| 1999 | W | W | W | 577.0 | W | W | W | 506.0 | 506.8 | W | W | W |
| 2000 | W | W | W | W | W | W | 454.9 | W | W | W | W | W |
| 2001 | W | W | W | W | W | W | W | W | W | W | W | W |
| 2002 | W | W | W | W | W | W | W | W | W | W | W | W |
| 2003 | W | W | W | 516.3 | W | W | W | W | W | W | W | W |
| 2004 | W | W | W | W | 422.3 | W | W | W | W | W | W | W |
| 2005 | W | W | 414.2 | W | 411.0 | 439.0 | 419.7 | 465.6 | W | 480.8 | W | W |
| 2006 | 476.1 | 518.7 | W | 475.6 | 475.6 | W | 493.1 | 572.8 | 506.3 | 537.6 | 501.3 | 391.7 |
| 2007 | 250.2 | 318.2 | 195.0 | 157.7 | 162.8 | W | 158.4 | 161.0 | W | W | W | W |
| 2008 | W | W | W | 142.7 | W | 110.7 | W | W | W | W | W | W |
| 2009 | W | W | W | W | W | W | W | W | W | W | W | W |
| 2010 | W | W | W | W | W | W | W | W | W | W | W | W |
| 2011 | W | W | W | NA | - | - | - | - | - | - | - | - |
| 2012 | - | - | - | - | - | - | - | - | - | - | - | - |
| 2013 | - | - | - | - | - | - | - | - | - | - | - | W |
| 2014 | - | - | - | - | - | - | - | - | - | - | - | - |
| 2015 | - | - | - | - | - | - | - | - | - | - | - | - |
| 2016 | - | - | - | - | - | - | - | - | - | - | - | - |
| 2017 | - | - | - | - | - | - | - | - | - | - | - | - |
| 2018 | - | - | - | - | - | - | - | - | - | - | - | - |
| 2019 | - | - | - | - | - | - | - | - | - | - | - | - |
| 2020 | - | - | - | - | - | - | - | - | - | - | - | - |
| 2021 | - | - | - | - | - | - | - | - | - | - | - | - |
| 2022 | - | - | - | |||||||||
| - = No Data Reported; -- = Not Applicable; NA = Not Available; W = Withheld to avoid disclosure of individual company data. |
| Release Date: 6/1/2022 |
| Next Release Date: TBD |