|
Download Data (XLS File) |
|
||||||||
|
||||||||
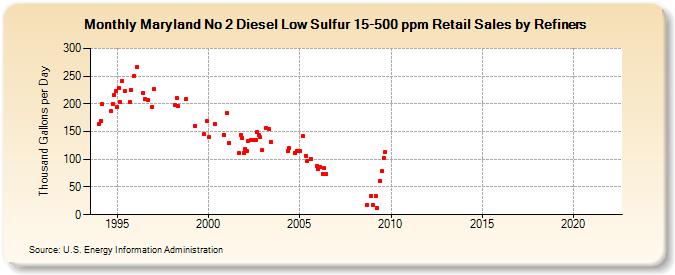
| Maryland No 2 Diesel Low Sulfur 15-500 ppm Retail Sales by Refiners (Thousand Gallons per Day) | ||||||||
| Year | Jan | Feb | Mar | Apr | May | Jun | Jul | Aug | Sep | Oct | Nov | Dec |
|---|---|---|---|---|---|---|---|---|---|---|---|---|
| 1994 | 164.5 | 169.9 | 200.0 | W | W | W | W | W | 186.6 | 199.7 | 216.1 | 223.5 |
| 1995 | 193.9 | 229.4 | 202.8 | 241.8 | W | 222.8 | W | W | 204.2 | 225.5 | W | 250.5 |
| 1996 | W | 266.8 | W | W | W | 219.4 | 208.0 | W | 206.1 | W | W | 194.0 |
| 1997 | 226.9 | W | W | W | W | W | W | W | W | W | W | W |
| 1998 | W | W | 198.2 | 210.4 | 195.3 | W | W | W | W | 208.3 | W | W |
| 1999 | W | W | W | 159.3 | W | W | W | W | W | 145.3 | W | 168.4 |
| 2000 | 139.5 | W | W | W | 163.8 | W | W | W | W | W | 144.3 | W |
| 2001 | 183.3 | 129.7 | W | W | W | W | W | W | 111.1 | 144.5 | 138.5 | 112.1 |
| 2002 | 118.7 | 114.1 | 133.8 | W | 135.5 | 135.3 | 134.7 | 135.3 | 149.4 | 143.2 | 139.6 | 115.9 |
| 2003 | W | W | 157.0 | W | 155.0 | 132.0 | W | W | W | W | W | W |
| 2004 | W | W | W | W | 114.7 | 119.8 | W | W | W | 111.3 | 115.6 | W |
| 2005 | 114.5 | W | 141.2 | W | 106.4 | 97.6 | W | 99.7 | W | W | W | 87.6 |
| 2006 | 81.9 | 86.3 | W | 74.1 | 83.8 | 74.1 | W | W | W | W | W | W |
| 2007 | W | W | W | - | W | W | W | W | W | W | W | W |
| 2008 | W | W | W | W | W | W | W | W | 16.8 | W | W | 34.1 |
| 2009 | 18.3 | W | 33.2 | 12.0 | W | 61.7 | 78.5 | 102.6 | 112.7 | W | W | W |
| 2010 | W | W | W | W | W | W | W | W | W | W | W | W |
| 2011 | W | W | W | W | W | W | W | W | W | W | W | W |
| 2012 | W | W | W | W | W | W | W | W | W | - | W | - |
| 2013 | - | - | - | - | - | - | - | - | - | - | - | - |
| 2014 | - | - | - | - | - | - | - | - | - | - | - | - |
| 2015 | - | - | - | - | - | - | - | - | - | - | - | - |
| 2016 | - | - | - | - | - | - | - | - | - | - | - | - |
| 2017 | - | - | - | - | - | - | - | - | - | - | - | - |
| 2018 | - | - | - | - | - | - | - | - | - | - | - | - |
| 2019 | - | - | - | - | - | - | - | - | - | - | - | - |
| 2020 | - | - | - | - | - | - | - | - | - | - | - | - |
| 2021 | - | - | - | - | - | - | - | - | - | - | - | - |
| 2022 | - | - | - | |||||||||
| - = No Data Reported; -- = Not Applicable; NA = Not Available; W = Withheld to avoid disclosure of individual company data. |
| Release Date: 6/1/2022 |
| Next Release Date: TBD |