|
Download Data (XLS File) |
|
||||||||
|
||||||||
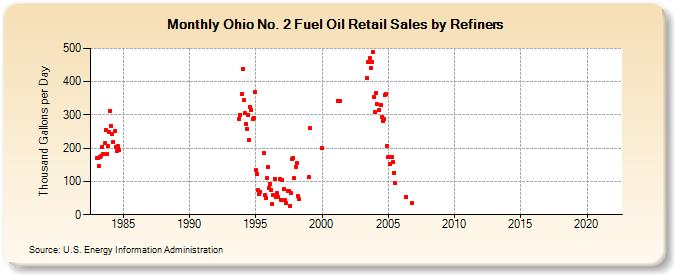
| Ohio No. 2 Fuel Oil Retail Sales by Refiners (Thousand Gallons per Day) | ||||||||
| Year | Jan | Feb | Mar | Apr | May | Jun | Jul | Aug | Sep | Oct | Nov | Dec |
|---|---|---|---|---|---|---|---|---|---|---|---|---|
| 1983 | 170.9 | 169.4 | 145.4 | 173.3 | 177.1 | 204.9 | 183.8 | 214.4 | 255.6 | 181.5 | 205.1 | 248.2 |
| 1984 | 312.6 | 267.1 | 243.5 | 219.5 | 251.5 | 202.1 | 190.1 | 205.5 | 193.1 | |||
| 1993 | 289.2 | 300.1 | 362.2 | |||||||||
| 1994 | 439.2 | 344.1 | 304.5 | 271.9 | 258.8 | 298.8 | 226.0 | 324.9 | 315.2 | 286.4 | 290.8 | 369.0 |
| 1995 | 134.2 | 122.6 | 73.3 | 63.6 | 69.3 | W | W | 186.2 | 58.7 | 51.6 | 110.5 | 143.7 |
| 1996 | 81.6 | 92.9 | 73.7 | 32.0 | 58.4 | 108.5 | 52.7 | 66.3 | 51.8 | W | 107.1 | 45.2 |
| 1997 | 104.5 | 75.8 | 44.8 | 34.4 | W | 72.7 | 71.5 | 26.9 | 65.4 | 168.7 | 171.9 | 109.5 |
| 1998 | 143.5 | 155.6 | 56.0 | 47.0 | W | W | W | W | W | W | W | W |
| 1999 | 113.4 | 260.7 | W | W | W | W | W | W | W | W | W | W |
| 2000 | 199.6 | W | W | W | W | W | W | W | W | W | W | W |
| 2001 | W | W | 343.3 | W | 342.0 | W | W | W | W | W | W | W |
| 2002 | W | W | W | W | W | W | W | W | W | W | W | W |
| 2003 | W | W | W | W | W | 412.3 | 458.1 | 471.0 | 441.8 | 457.8 | 488.4 | 354.4 |
| 2004 | 307.6 | 366.9 | 331.4 | W | 313.7 | 330.0 | 294.0 | 281.0 | 286.6 | 360.3 | 362.7 | 207.3 |
| 2005 | 173.6 | 174.2 | 151.4 | 172.3 | 157.8 | 126.3 | 94.9 | W | W | W | W | W |
| 2006 | W | W | W | W | 54.5 | W | W | W | W | 35.0 | W | W |
| 2007 | W | W | W | W | W | W | W | - | - | - | W | W |
| 2008 | W | W | W | W | W | W | W | W | W | W | W | W |
| 2009 | W | W | W | W | W | W | W | W | W | W | W | W |
| 2010 | W | W | - | - | - | - | - | - | - | - | - | - |
| 2011 | - | - | - | - | - | - | - | - | - | - | - | - |
| 2012 | - | - | - | - | - | - | - | - | - | - | - | - |
| 2013 | - | - | - | - | - | - | - | - | - | - | - | - |
| 2014 | - | - | - | - | - | - | - | - | - | - | - | - |
| 2015 | - | - | - | - | - | - | - | - | - | - | - | - |
| 2016 | - | - | - | - | - | - | - | - | - | - | - | - |
| 2017 | - | - | - | - | - | - | - | - | - | - | - | - |
| 2018 | - | - | - | - | - | - | - | - | - | - | - | - |
| 2019 | - | - | - | - | - | - | - | - | - | - | - | - |
| 2020 | - | - | - | - | - | - | - | - | - | - | - | - |
| 2021 | - | - | - | - | - | - | - | - | - | - | - | - |
| 2022 | - | - | - | |||||||||
| - = No Data Reported; -- = Not Applicable; NA = Not Available; W = Withheld to avoid disclosure of individual company data. |
| Release Date: 6/1/2022 |
| Next Release Date: TBD |