|
Download Data (XLS File) |
|
||||||||
|
||||||||
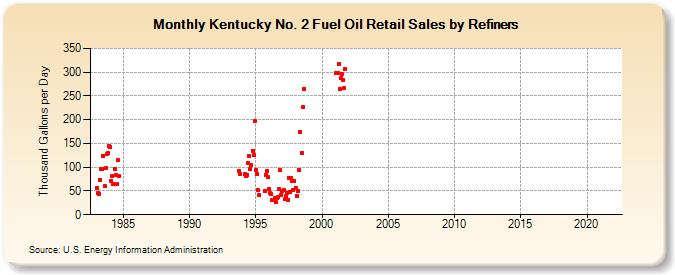
| Kentucky No. 2 Fuel Oil Retail Sales by Refiners (Thousand Gallons per Day) | ||||||||
| Year | Jan | Feb | Mar | Apr | May | Jun | Jul | Aug | Sep | Oct | Nov | Dec |
|---|---|---|---|---|---|---|---|---|---|---|---|---|
| 1983 | 56.8 | 46.1 | 44.5 | 74.1 | 95.9 | 96.3 | 124.0 | 60.7 | 97.3 | 126.9 | 129.2 | 144.6 |
| 1984 | 141.5 | 70.5 | 80.5 | 65.1 | 95.6 | 83.3 | 64.7 | 115.5 | 82.1 | |||
| 1993 | 91.9 | 86.1 | W | |||||||||
| 1994 | W | W | 85.9 | 81.9 | 82.9 | 108.9 | 123.5 | 95.9 | 104.3 | 134.9 | 125.4 | 196.8 |
| 1995 | 93.2 | 85.7 | 51.7 | 41.2 | W | W | W | W | 49.8 | 84.2 | 91.1 | 78.9 |
| 1996 | 53.9 | 44.8 | 42.9 | 30.6 | 30.1 | 35.3 | 26.2 | 34.7 | 36.7 | 53.1 | 95.1 | 42.1 |
| 1997 | 50.4 | 51.4 | 32.5 | 38.9 | 45.4 | 31.8 | 77.3 | 47.5 | 77.1 | 71.4 | 52.4 | 70.7 |
| 1998 | 57.2 | 40.2 | 49.9 | 94.4 | 174.7 | W | 130.4 | 226.5 | 265.2 | W | W | W |
| 1999 | W | W | W | W | W | W | W | W | W | W | W | W |
| 2000 | W | W | W | W | W | W | W | W | W | W | W | W |
| 2001 | W | 297.9 | 297.8 | 317.9 | 264.2 | 286.9 | 296.3 | 283.8 | 266.2 | 306.3 | W | W |
| 2002 | W | W | W | W | W | W | W | W | W | W | W | W |
| 2003 | W | W | W | W | W | W | W | W | W | W | W | W |
| 2004 | W | W | W | W | W | W | W | W | W | W | W | W |
| 2005 | W | W | W | W | W | W | W | W | W | W | W | W |
| 2006 | W | W | W | W | W | W | W | W | W | - | W | - |
| 2007 | - | - | - | - | - | - | - | - | - | - | W | W |
| 2008 | W | W | W | W | W | W | W | W | W | W | W | W |
| 2009 | W | W | W | W | W | W | W | W | W | W | W | W |
| 2010 | W | - | - | - | - | - | - | - | - | - | - | - |
| 2011 | - | - | - | - | - | - | - | - | - | - | - | - |
| 2012 | - | - | - | - | - | - | - | - | - | - | - | - |
| 2013 | - | - | - | - | - | - | - | - | - | - | - | - |
| 2014 | - | - | - | - | - | - | - | - | - | - | - | - |
| 2015 | - | - | - | - | - | - | - | - | - | - | - | - |
| 2016 | - | - | - | - | - | - | - | - | - | - | - | - |
| 2017 | - | - | - | - | - | - | - | - | - | - | - | - |
| 2018 | - | - | - | - | - | - | - | - | - | - | - | - |
| 2019 | - | - | - | - | - | - | - | - | - | - | - | - |
| 2020 | - | - | - | - | - | - | - | - | - | - | - | - |
| 2021 | - | - | - | - | - | - | - | - | - | - | - | - |
| 2022 | - | - | - | |||||||||
| - = No Data Reported; -- = Not Applicable; NA = Not Available; W = Withheld to avoid disclosure of individual company data. |
| Release Date: 6/1/2022 |
| Next Release Date: TBD |