|
Download Data (XLS File) |
|
||||||||
|
||||||||
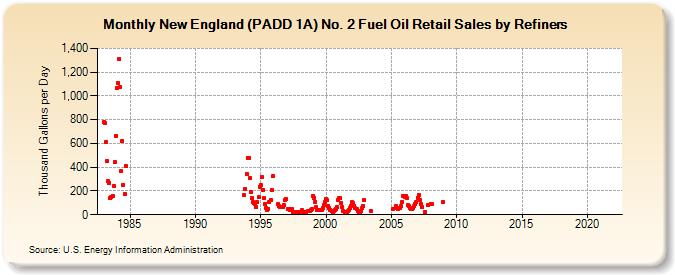
| New England (PADD 1A) No. 2 Fuel Oil Retail Sales by Refiners (Thousand Gallons per Day) | ||||||||
| Year | Jan | Feb | Mar | Apr | May | Jun | Jul | Aug | Sep | Oct | Nov | Dec |
|---|---|---|---|---|---|---|---|---|---|---|---|---|
| 1983 | 777.1 | 768.0 | 610.9 | 449.7 | 281.1 | 270.2 | 137.5 | 148.3 | 159.7 | 244.1 | 444.2 | 666.3 |
| 1984 | 1,066.4 | 1,108.4 | 1,314.1 | 1,073.1 | 365.1 | 618.5 | 252.0 | 173.2 | 410.5 | |||
| 1993 | 166.5 | 219.3 | 341.9 | |||||||||
| 1994 | 480.5 | 478.4 | 307.0 | 190.1 | 143.3 | 108.6 | 99.0 | 94.3 | 63.2 | 104.1 | 146.6 | 236.2 |
| 1995 | 252.1 | 319.0 | 208.7 | 142.4 | 87.5 | 57.7 | 43.8 | 51.2 | 103.9 | 126.0 | 210.4 | 322.7 |
| 1996 | W | W | W | W | 89.4 | 71.7 | 60.8 | 66.0 | 66.2 | 84.6 | 120.2 | 131.0 |
| 1997 | W | 46.3 | 44.6 | 36.5 | 39.8 | 46.7 | 21.4 | 20.1 | 23.8 | 24.2 | 21.3 | 19.0 |
| 1998 | W | W | 35.7 | 22.9 | 19.4 | 19.8 | 25.8 | 27.1 | 31.7 | 33.8 | 38.4 | 49.9 |
| 1999 | 159.1 | 144.8 | 110.0 | 62.8 | 42.2 | 40.7 | 37.9 | 40.1 | 42.6 | 55.2 | 78.7 | 109.1 |
| 2000 | 133.8 | 120.1 | 73.6 | 55.5 | 43.4 | 29.5 | 23.2 | 31.5 | 37.0 | 47.7 | 64.8 | 124.0 |
| 2001 | 142.7 | 137.9 | 99.9 | 62.8 | 30.7 | 20.8 | 19.1 | 20.4 | 28.7 | 41.7 | 59.8 | 75.3 |
| 2002 | 104.5 | 94.9 | 73.5 | 54.1 | 46.0 | 27.6 | 21.4 | 22.9 | 27.7 | 53.2 | 74.4 | 123.6 |
| 2003 | W | W | W | W | W | 35.3 | W | W | W | W | W | W |
| 2004 | W | W | W | W | W | W | W | W | W | W | W | W |
| 2005 | W | 48.9 | W | W | 70.1 | 55.5 | 46.3 | 58.8 | 54.6 | 72.3 | 109.4 | 160.6 |
| 2006 | 149.6 | 160.1 | 144.5 | 78.3 | 71.2 | 55.0 | 44.6 | 50.9 | 53.9 | 74.7 | 91.6 | 104.0 |
| 2007 | 144.3 | 164.0 | 126.4 | 88.9 | 64.9 | W | W | 26.6 | W | W | 78.1 | W |
| 2008 | 91.7 | 87.8 | W | W | W | W | W | W | W | W | W | 107.6 |
| 2009 | W | W | W | W | W | W | W | W | W | W | W | W |
| 2010 | W | W | W | W | W | W | W | W | W | W | W | W |
| 2011 | W | W | W | W | W | W | W | W | W | W | W | W |
| 2012 | W | W | W | W | W | W | W | W | W | W | W | W |
| 2013 | W | W | W | W | W | W | W | W | W | NA | NA | - |
| 2014 | - | W | - | - | - | - | - | - | - | - | - | - |
| 2015 | - | - | - | - | - | - | - | - | - | - | - | - |
| 2016 | - | - | - | - | - | - | - | - | - | - | W | - |
| 2017 | - | W | - | - | - | - | - | - | - | - | - | - |
| 2018 | - | - | - | - | - | - | - | - | - | - | - | - |
| 2019 | - | - | - | - | - | - | - | - | - | - | - | - |
| 2020 | - | - | - | - | - | - | - | - | - | - | - | - |
| 2021 | - | - | - | - | - | - | - | - | - | - | - | - |
| 2022 | - | - | - | |||||||||
| - = No Data Reported; -- = Not Applicable; NA = Not Available; W = Withheld to avoid disclosure of individual company data. |
| Release Date: 6/1/2022 |
| Next Release Date: TBD |