|
Download Data (XLS File) |
|
||||||||
|
||||||||
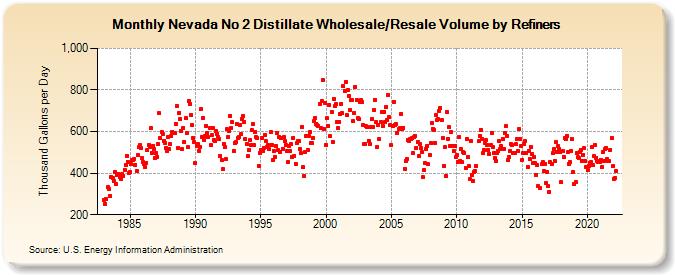
| Nevada No 2 Distillate Wholesale/Resale Volume by Refiners (Thousand Gallons per Day) | ||||||||
| Year | Jan | Feb | Mar | Apr | May | Jun | Jul | Aug | Sep | Oct | Nov | Dec |
|---|---|---|---|---|---|---|---|---|---|---|---|---|
| 1983 | 270.5 | 253.2 | 274.6 | W | 331.8 | 325.5 | 290.8 | 380.8 | 374.6 | 361.1 | 407.4 | 349.4 |
| 1984 | 392.5 | 397.3 | 388.7 | 380.2 | 371.8 | 395.3 | 388.5 | 416.8 | 439.2 | 484.2 | 454.8 | 398.5 |
| 1985 | 404.3 | 444.9 | 462.3 | 465.5 | 467.4 | 440.1 | 409.7 | 487.9 | 524.4 | 534.9 | 519.7 | 472.9 |
| 1986 | 454.6 | 445.3 | 430.6 | 450.5 | 509.5 | 535.1 | 523.9 | 615.0 | 498.6 | 532.9 | 515.3 | 472.5 |
| 1987 | 494.9 | 479.1 | 541.2 | 687.1 | 568.5 | 596.9 | 586.1 | 555.9 | 545.9 | 521.2 | 505.5 | 574.1 |
| 1988 | 515.5 | 540.2 | 577.5 | 599.4 | 594.5 | 593.5 | 636.7 | 723.0 | 523.1 | 691.1 | 658.0 | 603.0 |
| 1989 | 514.4 | 617.8 | 551.7 | 665.6 | 593.5 | 524.2 | 745.7 | 734.1 | 680.6 | 631.1 | 570.3 | 548.5 |
| 1990 | 447.2 | 531.9 | 540.8 | 506.6 | 525.6 | 706.4 | 574.1 | 667.3 | 560.0 | 579.9 | 627.8 | 594.1 |
| 1991 | 572.3 | 618.2 | 533.8 | 581.8 | 619.2 | 558.2 | 553.3 | 603.6 | 589.3 | 574.6 | 564.1 | 481.6 |
| 1992 | 463.7 | 417.5 | 541.8 | 524.2 | 466.3 | 610.5 | 575.6 | 600.4 | 676.9 | 617.6 | 644.6 | 506.8 |
| 1993 | 544.4 | 548.7 | 637.2 | 568.8 | 574.3 | 633.8 | 586.3 | 661.8 | 675.8 | 646.7 | 563.1 | 541.3 |
| 1994 | 480.2 | 512.1 | 557.5 | 533.5 | 605.2 | 635.0 | 534.7 | 600.2 | 572.4 | 567.8 | 436.6 | 497.1 |
| 1995 | 511.9 | 569.8 | 506.7 | 520.9 | 585.6 | 552.2 | 523.8 | 537.5 | 513.9 | 597.1 | 536.4 | 464.9 |
| 1996 | 505.8 | 479.8 | 531.5 | 594.8 | 510.4 | 574.3 | 502.0 | 569.4 | 518.4 | 571.8 | 553.0 | 537.0 |
| 1997 | 505.3 | 454.1 | 532.0 | 504.3 | 538.6 | 479.5 | 569.9 | 482.3 | 445.6 | 545.5 | 552.2 | 552.3 |
| 1998 | 514.5 | 495.1 | 622.6 | 429.3 | 387.0 | 501.3 | 579.9 | 512.5 | 580.8 | 597.7 | 546.8 | 544.9 |
| 1999 | 570.4 | 649.6 | 665.7 | 637.6 | 631.7 | 626.0 | 731.4 | 617.0 | 746.0 | 848.8 | 613.7 | 738.3 |
| 2000 | 537.6 | 663.8 | 627.9 | 728.6 | 576.3 | 695.6 | 551.2 | 757.9 | 723.5 | 732.3 | 647.5 | 617.4 |
| 2001 | 647.0 | 684.7 | 733.0 | 688.7 | 817.3 | 795.7 | 838.7 | 677.7 | 801.0 | 771.1 | 705.8 | 749.8 |
| 2002 | 751.8 | 649.6 | 690.8 | 816.1 | 751.9 | 665.4 | 661.0 | 743.8 | 750.0 | 744.0 | 633.3 | 540.6 |
| 2003 | 539.5 | 624.4 | 622.2 | 555.8 | 538.2 | 621.8 | 660.2 | 621.5 | 704.0 | 753.5 | 645.7 | 526.9 |
| 2004 | 630.4 | 565.0 | 645.5 | 694.5 | 628.5 | 695.9 | 645.9 | 717.7 | 654.5 | 776.7 | 668.6 | 632.2 |
| 2005 | 534.8 | 625.4 | 744.5 | 632.0 | 637.1 | 594.5 | W | 611.5 | 615.6 | 685.3 | 611.4 | 618.8 |
| 2006 | 420.5 | 460.0 | 468.8 | 559.6 | 556.8 | 561.9 | 565.6 | 569.7 | 494.6 | 575.4 | 578.0 | 522.9 |
| 2007 | 549.7 | 480.8 | 538.8 | 521.8 | 501.8 | 379.6 | 416.5 | 446.8 | 516.7 | 532.5 | 443.2 | 489.6 |
| 2008 | 546.0 | 641.4 | 614.5 | 609.6 | 547.1 | 679.1 | 656.0 | 658.5 | 700.6 | 713.7 | 654.5 | 569.4 |
| 2009 | 436.3 | 524.2 | 388.4 | 695.3 | 566.1 | 619.7 | 530.3 | 598.3 | 529.7 | 507.4 | 529.6 | 475.4 |
| 2010 | 487.8 | 454.4 | 575.8 | 457.0 | 515.5 | 451.4 | 500.5 | 498.1 | 426.6 | 565.0 | 479.2 | 432.6 |
| 2011 | 369.6 | 553.1 | 390.8 | 364.2 | 405.9 | 411.2 | 433.2 | W | 552.7 | 577.5 | 609.6 | 564.5 |
| 2012 | 495.9 | 509.1 | 545.6 | 557.0 | 536.5 | 511.6 | 492.5 | 536.8 | 590.9 | 524.4 | 496.3 | 473.1 |
| 2013 | 457.6 | 494.5 | 508.8 | 553.2 | 516.4 | 530.2 | 564.8 | 518.2 | 592.1 | 625.1 | 581.0 | 461.6 |
| 2014 | 479.5 | 506.2 | 540.1 | 536.5 | 495.0 | 494.6 | 539.2 | 562.7 | 508.5 | 611.5 | 565.0 | 530.8 |
| 2015 | 465.2 | 496.7 | 539.1 | 553.9 | 497.5 | 429.6 | 507.9 | 468.5 | 527.6 | 492.8 | 449.1 | 478.5 |
| 2016 | 446.6 | 392.2 | 438.5 | 336.9 | 328.7 | W | 442.3 | 452.5 | 409.9 | 445.1 | 353.1 | 406.0 |
| 2017 | 336.1 | 309.3 | 451.4 | 444.4 | 495.3 | 513.9 | 459.4 | 548.3 | 502.3 | 529.5 | 518.2 | 502.4 |
| 2018 | 355.4 | 504.3 | 479.2 | 567.8 | 561.8 | 580.7 | 502.8 | 444.5 | 452.3 | 508.4 | 563.0 | 406.1 |
| 2019 | 348.1 | 355.8 | 496.4 | 476.3 | 473.5 | 502.6 | 511.5 | 458.7 | 488.3 | 519.1 | 457.4 | 427.6 |
| 2020 | 415.1 | 435.5 | 450.4 | 453.1 | 526.2 | 436.8 | 480.9 | 535.9 | 474.3 | 457.5 | 454.8 | 451.8 |
| 2021 | 464.7 | 428.7 | 501.3 | 456.1 | 514.3 | 522.8 | 466.7 | 456.9 | 456.6 | 513.6 | 571.3 | 432.6 |
| 2022 | 373.1 | 377.1 | 408.9 | |||||||||
| - = No Data Reported; -- = Not Applicable; NA = Not Available; W = Withheld to avoid disclosure of individual company data. |
| Release Date: 6/1/2022 |
| Next Release Date: TBD |