|
Download Data (XLS File) |
|
||||||||
|
||||||||
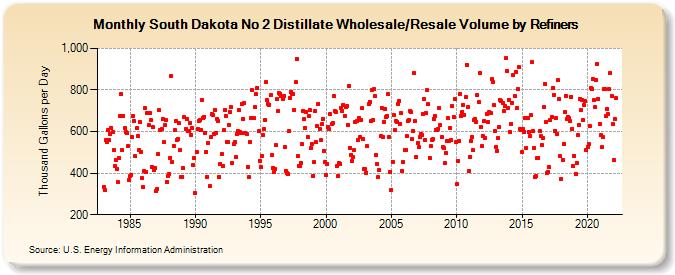
| South Dakota No 2 Distillate Wholesale/Resale Volume by Refiners (Thousand Gallons per Day) | ||||||||
| Year | Jan | Feb | Mar | Apr | May | Jun | Jul | Aug | Sep | Oct | Nov | Dec |
|---|---|---|---|---|---|---|---|---|---|---|---|---|
| 1983 | 332.1 | 317.9 | 557.8 | 551.7 | 605.4 | 559.2 | 589.5 | 617.1 | 596.1 | 510.2 | 434.7 | 464.7 |
| 1984 | 420.1 | 355.9 | 474.1 | 672.7 | 779.8 | 509.0 | 675.0 | 615.5 | 598.8 | 591.8 | 528.2 | 365.6 |
| 1985 | 385.7 | 392.4 | 574.2 | 675.1 | 649.7 | 481.7 | 616.8 | 579.5 | 509.9 | 646.4 | 500.9 | 374.2 |
| 1986 | 332.7 | 412.2 | 711.2 | 406.7 | 687.3 | 630.8 | 691.5 | 655.4 | 430.1 | 621.0 | 417.3 | 423.5 |
| 1987 | 316.1 | 322.5 | 493.0 | 702.3 | 607.3 | 611.1 | 660.5 | 547.7 | 633.5 | 654.6 | 358.8 | 384.6 |
| 1988 | 393.8 | 474.3 | 869.4 | 452.2 | 532.0 | 606.8 | 649.8 | 558.5 | 565.4 | 639.5 | 509.0 | 379.4 |
| 1989 | 381.5 | 422.7 | 669.5 | 611.1 | 661.5 | 602.9 | 603.4 | 642.2 | 582.0 | 618.1 | 441.5 | 471.7 |
| 1990 | 303.2 | 503.1 | 614.2 | 653.1 | 655.7 | 608.4 | 754.0 | 666.4 | 672.0 | 593.8 | 503.1 | 383.7 |
| 1991 | 544.2 | 339.0 | 574.4 | 683.8 | 679.3 | 587.5 | 704.6 | 593.8 | 662.3 | 649.9 | 382.2 | 445.7 |
| 1992 | 492.0 | 432.7 | 607.1 | 703.2 | 676.8 | 549.0 | 550.9 | 629.2 | 695.6 | 715.8 | 447.8 | 541.1 |
| 1993 | 549.1 | 477.2 | 587.0 | 600.7 | 703.5 | 598.4 | 591.7 | 732.8 | 659.8 | 737.4 | 595.3 | 589.9 |
| 1994 | 430.9 | 379.4 | 550.5 | 667.5 | 799.6 | 663.8 | 665.5 | 715.8 | 780.1 | 809.8 | 600.8 | 459.7 |
| 1995 | 427.4 | 483.4 | 582.8 | 611.1 | 656.8 | 839.4 | 750.1 | 730.4 | 729.6 | 773.8 | 485.6 | 424.8 |
| 1996 | 403.4 | 421.7 | 535.0 | 754.5 | 698.0 | 784.8 | 782.7 | 769.4 | 758.5 | 769.5 | 526.7 | 410.6 |
| 1997 | 400.2 | 397.1 | 602.6 | 763.4 | 792.0 | 782.7 | 781.4 | 704.9 | 837.3 | 949.4 | 480.2 | 436.0 |
| 1998 | 435.0 | 451.0 | 540.4 | 701.0 | 661.2 | 619.2 | 693.4 | 574.2 | 674.5 | 703.9 | 519.3 | 539.7 |
| 1999 | 386.4 | 453.4 | 697.1 | 549.4 | 626.4 | 733.8 | 610.3 | 558.4 | 634.1 | 661.4 | 505.6 | 454.5 |
| 2000 | 389.2 | 445.6 | 621.8 | 610.8 | 682.1 | 636.8 | 639.2 | 768.7 | 699.8 | 692.1 | 435.2 | 386.7 |
| 2001 | 447.2 | 446.1 | 715.0 | 700.2 | 730.1 | 675.1 | 716.5 | 722.7 | 632.7 | 819.6 | 522.2 | 489.0 |
| 2002 | 458.3 | 476.2 | 510.0 | 645.8 | 648.8 | 561.4 | 663.4 | 573.8 | 655.6 | 712.0 | 565.1 | 418.9 |
| 2003 | 419.2 | 402.0 | 528.9 | 732.8 | 744.5 | 649.0 | 797.9 | 654.5 | 802.3 | 770.4 | 486.4 | 441.8 |
| 2004 | 380.2 | 414.5 | 579.8 | 714.1 | 575.8 | 648.1 | 710.7 | 667.9 | 673.6 | 779.3 | 574.5 | 406.5 |
| 2005 | 320.6 | 455.7 | 677.8 | 605.3 | 652.3 | 647.4 | 734.0 | 744.9 | 636.9 | 688.1 | 411.2 | 453.3 |
| 2006 | 511.8 | 512.9 | 578.0 | 649.7 | 655.4 | 699.2 | 692.6 | 563.0 | 603.2 | 882.8 | 650.5 | 478.5 |
| 2007 | 546.2 | 523.4 | 573.5 | 589.5 | 582.1 | 685.1 | 756.8 | 559.9 | 689.0 | 797.5 | 731.0 | 474.7 |
| 2008 | 528.7 | 559.9 | 562.5 | 661.8 | 674.0 | 609.2 | 607.0 | 613.8 | 713.5 | 630.4 | 573.1 | 526.5 |
| 2009 | 520.4 | 449.4 | 497.2 | 554.4 | 663.5 | 556.6 | 617.5 | 557.1 | 721.5 | 670.6 | 756.7 | 550.9 |
| 2010 | 346.5 | 457.9 | 555.1 | 780.5 | 675.1 | 694.7 | 728.9 | 682.0 | 767.3 | 922.3 | 717.4 | 409.8 |
| 2011 | 479.4 | 553.8 | 574.8 | 509.6 | 654.8 | 659.5 | 646.9 | 776.5 | 741.0 | 881.5 | 623.2 | 530.8 |
| 2012 | 580.7 | 650.3 | 569.0 | W | 684.2 | 646.0 | 692.1 | 691.1 | 852.2 | 838.7 | 726.6 | 602.9 |
| 2013 | 526.7 | 508.5 | 568.5 | 621.1 | 750.5 | 746.5 | 737.6 | 700.6 | 724.0 | 952.5 | 890.8 | 713.0 |
| 2014 | 751.9 | 596.9 | 637.6 | 738.3 | 873.5 | 770.0 | 888.2 | 711.9 | 803.7 | 910.4 | 610.3 | 606.1 |
| 2015 | 499.5 | 612.3 | 596.7 | 665.1 | 521.8 | 666.3 | 599.3 | 577.9 | 679.4 | 932.6 | 603.1 | 521.2 |
| 2016 | 381.1 | 385.0 | 474.1 | 474.8 | 603.4 | 576.5 | 536.5 | 569.9 | 715.8 | 830.1 | 648.0 | 401.5 |
| 2017 | 407.1 | 427.9 | 655.9 | 668.7 | 810.5 | 777.9 | 603.9 | 663.5 | 588.9 | 847.3 | 755.6 | 480.7 |
| 2018 | 372.7 | 464.2 | 540.7 | 692.5 | 771.5 | 661.2 | 671.8 | 663.9 | 648.7 | 768.5 | 614.0 | 436.1 |
| 2019 | 482.8 | 397.3 | 450.1 | 582.1 | 630.9 | 757.6 | 704.5 | 754.0 | 653.8 | 726.4 | 746.7 | 509.7 |
| 2020 | 526.2 | 538.1 | 625.9 | 808.3 | 804.3 | 851.9 | 752.4 | 717.7 | 848.5 | 924.3 | 758.4 | 635.7 |
| 2021 | 581.4 | 523.4 | 573.5 | 806.8 | 802.4 | 673.3 | 707.8 | 682.1 | 802.9 | 881.8 | 772.7 | 636.1 |
| 2022 | 462.2 | 659.5 | 759.5 | |||||||||
| - = No Data Reported; -- = Not Applicable; NA = Not Available; W = Withheld to avoid disclosure of individual company data. |
| Release Date: 6/1/2022 |
| Next Release Date: TBD |