|
Download Data (XLS File) |
|
||||||||
|
||||||||
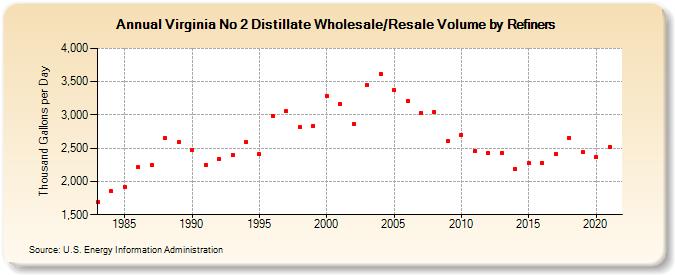
| Virginia No 2 Distillate Wholesale/Resale Volume by Refiners (Thousand Gallons per Day) | ||||||||
| Decade | Year-0 | Year-1 | Year-2 | Year-3 | Year-4 | Year-5 | Year-6 | Year-7 | Year-8 | Year-9 |
|---|---|---|---|---|---|---|---|---|---|---|
| 1980's | 1,691.8 | 1,849.4 | 1,922.6 | 2,213.3 | 2,249.0 | 2,654.7 | 2,586.7 | |||
| 1990's | 2,479.3 | 2,247.8 | 2,339.8 | 2,399.3 | 2,594.5 | 2,409.6 | 2,989.0 | 3,052.5 | 2,811.8 | 2,835.9 |
| 2000's | 3,286.6 | 3,167.0 | 2,867.5 | 3,446.7 | 3,616.6 | 3,377.2 | 3,214.1 | 3,029.2 | 3,044.2 | 2,612.5 |
| 2010's | 2,705.5 | 2,463.1 | 2,427.3 | 2,433.8 | 2,194.0 | 2,270.4 | 2,278.9 | 2,419.1 | 2,657.4 | 2,441.8 |
| 2020's | 2,365.9 |
| - = No Data Reported; -- = Not Applicable; NA = Not Available; W = Withheld to avoid disclosure of individual company data. |
| Release Date: 6/1/2022 |
| Next Release Date: TBD |