|
Download Data (XLS File) |
|
||||||||
|
||||||||
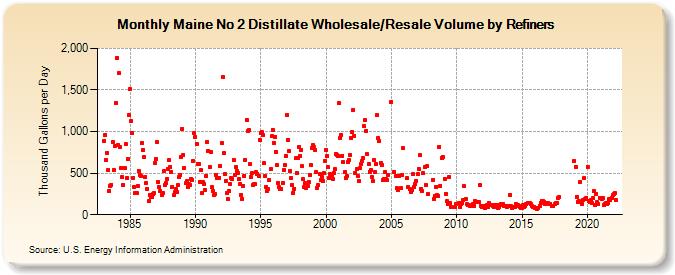
| Maine No 2 Distillate Wholesale/Resale Volume by Refiners (Thousand Gallons per Day) | ||||||||
| Year | Jan | Feb | Mar | Apr | May | Jun | Jul | Aug | Sep | Oct | Nov | Dec |
|---|---|---|---|---|---|---|---|---|---|---|---|---|
| 1983 | 887.6 | 955.4 | 662.9 | 746.4 | 533.0 | 289.6 | 346.0 | 360.6 | 876.8 | 539.3 | 826.9 | 1,344.3 |
| 1984 | 1,888.5 | 839.2 | 1,702.4 | 808.6 | 567.4 | 454.9 | 359.2 | 562.0 | 846.1 | 438.7 | 669.8 | 1,195.2 |
| 1985 | 1,510.2 | 1,121.3 | 984.0 | 441.7 | 338.5 | 257.2 | 259.6 | 350.8 | 531.5 | 472.6 | 471.0 | 863.5 |
| 1986 | 781.6 | 692.7 | 453.8 | 381.6 | 313.3 | 164.2 | 238.6 | 210.2 | 218.8 | 246.3 | 263.5 | 624.0 |
| 1987 | 671.4 | 870.6 | 394.8 | 332.7 | 283.3 | 238.1 | 263.4 | 520.1 | 358.7 | 375.5 | 431.3 | 549.2 |
| 1988 | 653.3 | 574.7 | 519.0 | 335.3 | 234.1 | 268.4 | 313.5 | 267.5 | 355.1 | 448.8 | 479.9 | 695.6 |
| 1989 | 1,036.1 | 718.6 | 565.1 | 375.5 | 399.7 | 334.0 | 373.9 | 357.0 | 434.7 | 413.6 | 646.7 | 982.3 |
| 1990 | 935.5 | 854.5 | 614.9 | 605.5 | 399.2 | 534.6 | 257.2 | 390.1 | 364.0 | 294.8 | 466.4 | 879.1 |
| 1991 | 763.9 | 572.9 | 758.9 | 329.9 | 285.7 | 238.3 | 249.4 | 476.2 | 441.0 | 437.8 | 444.8 | 590.8 |
| 1992 | 862.2 | 1,650.2 | 736.7 | 485.0 | 411.1 | 263.8 | 188.1 | 288.9 | 369.0 | 442.4 | 426.5 | 663.3 |
| 1993 | 478.4 | 570.3 | 529.4 | 506.6 | 428.3 | 364.5 | 234.1 | 190.1 | 350.8 | 466.7 | 661.5 | 1,143.4 |
| 1994 | 1,001.3 | 1,020.3 | 607.4 | 459.1 | 496.0 | 362.7 | 364.7 | 364.4 | 512.8 | 495.5 | 468.2 | 903.3 |
| 1995 | 977.2 | 990.9 | 959.0 | 616.2 | 468.1 | 336.5 | 289.3 | 304.5 | 416.5 | 545.3 | 941.6 | 1,021.9 |
| 1996 | 864.8 | 938.6 | 759.3 | 595.5 | 384.0 | 328.2 | 311.5 | 304.0 | 383.9 | 537.1 | 595.1 | 711.0 |
| 1997 | 1,203.2 | 900.1 | 769.0 | 528.4 | 443.0 | 354.4 | 267.1 | 314.7 | 679.5 | 503.9 | 684.1 | 811.5 |
| 1998 | 708.0 | 781.8 | 581.9 | 423.9 | 329.2 | 381.9 | 324.8 | 345.7 | 399.3 | 477.7 | 596.8 | 805.5 |
| 1999 | 837.6 | 810.3 | 780.3 | 513.1 | 324.4 | 352.9 | 484.7 | 415.3 | 454.4 | 411.3 | 498.1 | 649.7 |
| 2000 | 782.8 | 706.8 | 572.8 | 441.0 | 485.2 | 472.5 | 433.5 | 505.9 | 544.8 | 735.4 | 717.8 | 707.2 |
| 2001 | 1,338.5 | 927.5 | 956.6 | 711.7 | 629.7 | 509.9 | 441.5 | 461.4 | 634.7 | 652.0 | 723.6 | 920.7 |
| 2002 | 992.9 | 1,260.3 | 952.1 | 507.1 | 546.7 | 459.8 | 407.8 | 556.7 | 608.7 | 650.5 | 687.1 | 1,061.4 |
| 2003 | 1,134.8 | 1,008.5 | 724.7 | 609.3 | 517.8 | 535.9 | 453.0 | 401.2 | 657.4 | 508.6 | 612.5 | 1,198.1 |
| 2004 | 920.2 | 883.4 | 619.5 | 596.6 | 414.3 | 433.8 | 511.4 | 432.4 | 416.9 | 481.4 | W | W |
| 2005 | 1,360.6 | W | 517.5 | W | 463.9 | 316.8 | 293.1 | 461.3 | W | 317.9 | 479.5 | 798.7 |
| 2006 | W | W | 436.2 | 332.3 | W | 306.6 | 267.6 | 301.3 | 489.2 | 339.2 | 373.0 | 405.6 |
| 2007 | 484.7 | 551.8 | 714.7 | 309.0 | 290.5 | 498.5 | W | 575.6 | 354.7 | 580.6 | 245.2 | W |
| 2008 | W | W | 422.3 | 189.5 | 230.3 | 336.6 | 236.0 | 229.0 | 818.5 | 348.9 | 687.5 | 697.3 |
| 2009 | W | 435.1 | 254.1 | 160.5 | 124.0 | 448.2 | 141.9 | 93.0 | W | W | 91.3 | 134.2 |
| 2010 | W | W | 140.7 | 93.9 | 131.5 | 143.9 | 177.6 | 343.1 | 184.0 | 125.3 | 116.6 | 116.8 |
| 2011 | 107.9 | W | 102.7 | 128.2 | 108.9 | 162.2 | 158.4 | 155.1 | 155.6 | 354.1 | 109.1 | 94.1 |
| 2012 | 109.5 | 109.3 | 81.1 | 88.2 | 117.0 | 90.8 | 143.3 | 120.5 | 114.4 | 107.3 | 88.5 | 115.3 |
| 2013 | 104.9 | 111.4 | 81.3 | 87.5 | 118.3 | 132.6 | 124.6 | 105.0 | 102.7 | 102.1 | 95.4 | 102.0 |
| 2014 | 105.7 | 240.5 | 99.7 | 84.6 | 90.3 | 94.1 | 126.6 | 115.2 | 112.3 | 109.2 | 94.5 | 76.3 |
| 2015 | 84.5 | 118.3 | 87.7 | 100.3 | 125.2 | 135.7 | 142.0 | 137.3 | 128.8 | 108.5 | 91.6 | 95.7 |
| 2016 | 85.5 | 79.3 | 62.8 | 83.4 | 102.8 | 142.9 | 161.9 | 170.1 | 158.6 | 132.8 | 136.5 | 146.2 |
| 2017 | 140.5 | 127.5 | 132.2 | 101.4 | 106.9 | NA | 124.2 | 142.8 | 141.2 | 201.5 | 207.6 | W |
| 2018 | W | W | W | W | W | W | W | W | W | W | W | W |
| 2019 | 648.3 | 578.8 | 213.9 | 154.3 | 163.8 | 392.5 | 150.8 | 133.8 | 179.1 | 441.3 | 185.8 | 206.5 |
| 2020 | 578.9 | 165.9 | 155.9 | 180.1 | 135.5 | 196.4 | 284.3 | 120.3 | 254.9 | 155.3 | 128.2 | 204.4 |
| 2021 | 195.8 | 189.2 | 196.3 | 111.3 | 130.0 | 143.8 | 128.8 | 137.6 | 185.4 | 172.9 | 201.9 | 232.0 |
| 2022 | 251.8 | 262.4 | 182.5 | |||||||||
| - = No Data Reported; -- = Not Applicable; NA = Not Available; W = Withheld to avoid disclosure of individual company data. |
| Release Date: 6/1/2022 |
| Next Release Date: TBD |