|
Download Data (XLS File) |
|
||||||||
|
||||||||
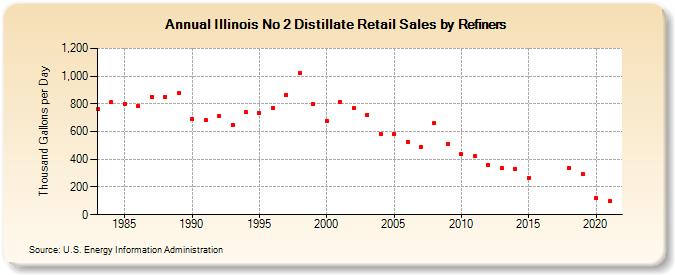
| Illinois No 2 Distillate Retail Sales by Refiners (Thousand Gallons per Day) | ||||||||
| Decade | Year-0 | Year-1 | Year-2 | Year-3 | Year-4 | Year-5 | Year-6 | Year-7 | Year-8 | Year-9 |
|---|---|---|---|---|---|---|---|---|---|---|
| 1980's | 760.7 | 811.0 | 799.2 | 783.8 | 852.6 | 851.3 | 875.8 | |||
| 1990's | 691.9 | 680.1 | 709.0 | 649.6 | 741.0 | 733.7 | 771.3 | 867.2 | 1,022.4 | 796.1 |
| 2000's | 676.4 | 812.7 | 768.1 | 722.2 | 580.5 | 583.2 | 527.6 | 490.0 | 660.7 | 512.1 |
| 2010's | 435.9 | 421.9 | 358.0 | 335.7 | 331.9 | 267.9 | W | W | 338.6 | 292.1 |
| 2020's | 119.0 |
| - = No Data Reported; -- = Not Applicable; NA = Not Available; W = Withheld to avoid disclosure of individual company data. |
| Release Date: 6/1/2022 |
| Next Release Date: TBD |