|
Download Data (XLS File) |
|
||||||||
|
||||||||
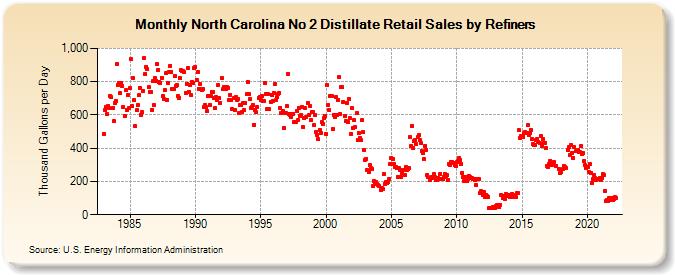
| North Carolina No 2 Distillate Retail Sales by Refiners (Thousand Gallons per Day) | ||||||||
| Year | Jan | Feb | Mar | Apr | May | Jun | Jul | Aug | Sep | Oct | Nov | Dec |
|---|---|---|---|---|---|---|---|---|---|---|---|---|
| 1983 | 487.7 | 629.7 | 647.6 | 605.4 | 653.9 | 638.8 | 714.7 | 705.6 | 640.4 | 561.7 | 672.0 | 681.0 |
| 1984 | 904.1 | 780.5 | 792.4 | 730.6 | 792.8 | 774.3 | 647.9 | 590.7 | 747.3 | 632.3 | 721.2 | 640.3 |
| 1985 | 759.9 | 933.8 | 651.1 | 819.6 | 687.1 | 530.6 | 627.9 | 657.9 | 717.0 | 763.8 | 602.5 | 616.9 |
| 1986 | 746.4 | 942.9 | 846.4 | 888.8 | 873.1 | 765.6 | 739.5 | 737.6 | 630.3 | 801.3 | 657.6 | 821.8 |
| 1987 | 806.1 | 903.9 | 872.5 | 798.8 | 792.3 | 823.5 | 712.5 | 694.6 | 747.6 | 849.9 | 690.2 | 792.8 |
| 1988 | 860.8 | 895.9 | 857.0 | 757.8 | 753.8 | 836.1 | 772.5 | 780.8 | 713.9 | 703.4 | 819.9 | 869.3 |
| 1989 | 861.1 | 862.6 | 857.3 | 732.8 | 788.9 | 884.8 | 740.3 | 782.6 | 717.9 | 798.6 | 793.9 | 881.8 |
| 1990 | 885.8 | 808.6 | 858.5 | 756.8 | 787.9 | 758.2 | 748.6 | 754.8 | 647.7 | 660.3 | 644.8 | 623.5 |
| 1991 | 716.7 | 659.5 | 712.1 | 738.0 | 735.0 | 699.8 | 640.9 | 708.6 | 688.8 | 778.2 | 701.6 | 670.8 |
| 1992 | 822.7 | 754.2 | 765.8 | 770.8 | 757.4 | 766.5 | 764.4 | 688.3 | 721.3 | 687.8 | 633.7 | 699.7 |
| 1993 | 629.8 | 707.3 | 691.3 | 694.8 | 609.9 | 662.2 | 657.1 | 617.8 | 672.3 | 629.1 | 670.9 | 723.5 |
| 1994 | 797.8 | 723.1 | 694.3 | 641.7 | 650.3 | 661.4 | 540.9 | 631.5 | 615.4 | 648.1 | 702.1 | 710.6 |
| 1995 | 688.3 | 716.6 | 686.1 | 686.6 | 790.5 | 726.1 | 633.5 | 725.7 | 634.4 | 678.8 | 720.6 | 683.2 |
| 1996 | 732.1 | 786.9 | 689.6 | 707.1 | 725.1 | 731.4 | 643.2 | 611.1 | 621.1 | 522.3 | 612.1 | 610.7 |
| 1997 | 652.6 | 848.2 | 603.7 | 600.5 | 586.7 | 605.9 | 607.9 | 560.4 | 560.2 | 621.2 | 567.7 | 641.9 |
| 1998 | 595.2 | 597.9 | 649.8 | 527.2 | 579.3 | 639.2 | 587.3 | 670.4 | 597.2 | 655.2 | 569.4 | 614.8 |
| 1999 | 616.4 | 537.3 | 598.8 | 499.2 | 479.9 | 452.3 | 509.4 | 492.7 | 555.9 | 544.4 | 580.0 | 596.1 |
| 2000 | 486.5 | 779.2 | 657.7 | 628.4 | 714.8 | 712.7 | 514.0 | 597.7 | 587.5 | 706.3 | 601.7 | 692.7 |
| 2001 | 826.0 | 604.7 | 767.9 | 765.4 | 679.3 | 592.6 | 564.4 | 674.3 | 557.9 | 696.4 | 578.6 | 488.2 |
| 2002 | 641.1 | 521.3 | 568.4 | 527.1 | 611.4 | 446.6 | 490.0 | 462.6 | 448.5 | 566.9 | 496.2 | 388.5 |
| 2003 | 331.3 | 337.9 | 267.8 | 255.3 | 297.0 | 283.0 | 276.3 | 171.7 | 199.8 | 183.9 | 196.0 | 183.0 |
| 2004 | 180.0 | 172.3 | 151.0 | 157.8 | 155.0 | 244.4 | 186.6 | 199.0 | 191.7 | 196.0 | 216.8 | 306.9 |
| 2005 | 343.6 | 332.0 | 305.4 | 285.7 | 284.9 | 280.2 | 228.5 | 281.2 | 266.3 | 229.5 | 248.8 | 269.1 |
| 2006 | 238.9 | 285.7 | 270.4 | 275.2 | 277.9 | 466.4 | 412.1 | 533.1 | 402.2 | 446.0 | 449.2 | 422.4 |
| 2007 | 465.8 | 476.3 | 446.6 | 432.1 | 381.5 | 368.5 | 333.3 | 415.1 | 391.2 | 239.1 | 224.7 | 206.3 |
| 2008 | 221.1 | 227.2 | 220.9 | 244.2 | 224.0 | 209.4 | 211.2 | 223.7 | 213.7 | 246.1 | 217.7 | 216.4 |
| 2009 | 227.4 | 243.7 | 234.9 | 236.4 | 209.5 | 303.8 | 299.3 | 319.2 | 316.7 | 312.5 | 299.7 | 292.1 |
| 2010 | 316.3 | 325.3 | 338.7 | 330.1 | 303.5 | 252.6 | 224.2 | 205.6 | 228.6 | 203.4 | 216.7 | 234.8 |
| 2011 | 227.5 | 221.8 | 223.5 | 213.0 | 216.8 | 208.6 | 177.6 | 214.2 | 212.8 | 128.6 | 139.7 | 133.2 |
| 2012 | 120.7 | 135.3 | 109.4 | 118.5 | 113.2 | 108.0 | 41.6 | 40.2 | 37.8 | 45.7 | 49.0 | 42.5 |
| 2013 | 50.4 | 57.4 | 43.4 | 46.9 | 59.0 | 118.8 | 98.8 | 111.3 | 96.8 | 127.5 | 112.6 | 112.7 |
| 2014 | 115.9 | 103.9 | 105.6 | 125.6 | 118.8 | 105.8 | 104.4 | 129.9 | 132.4 | 506.5 | 461.6 | 475.0 |
| 2015 | 474.5 | 469.0 | 490.4 | 495.6 | 493.2 | 536.6 | 481.7 | 490.1 | 510.7 | 454.2 | 424.4 | 417.8 |
| 2016 | 422.1 | 447.9 | 455.8 | 439.0 | 432.7 | 474.6 | 410.8 | 453.3 | 433.3 | 432.9 | 398.9 | 295.2 |
| 2017 | 288.0 | 306.8 | 325.4 | 299.9 | 305.1 | 319.6 | W | 292.9 | W | W | 274.3 | 248.8 |
| 2018 | 258.4 | 272.2 | 293.6 | 286.4 | 279.4 | W | 391.9 | 405.9 | 359.7 | 416.3 | 373.7 | 342.1 |
| 2019 | 406.3 | 381.8 | 380.5 | 389.0 | 374.9 | 378.7 | 412.0 | 366.9 | 370.3 | 323.8 | 298.2 | 280.2 |
| 2020 | 284.2 | 256.5 | 304.8 | 249.3 | 189.4 | 213.2 | 238.1 | 219.4 | 209.4 | 216.4 | 217.6 | 219.8 |
| 2021 | 207.3 | 220.5 | 243.4 | 240.4 | 145.5 | 82.6 | 91.0 | 83.5 | 101.1 | 85.8 | 99.3 | 91.3 |
| 2022 | 92.8 | 104.4 | 101.8 | |||||||||
| - = No Data Reported; -- = Not Applicable; NA = Not Available; W = Withheld to avoid disclosure of individual company data. |
| Release Date: 6/1/2022 |
| Next Release Date: TBD |