|
Download Data (XLS File) |
|
||||||||
|
||||||||
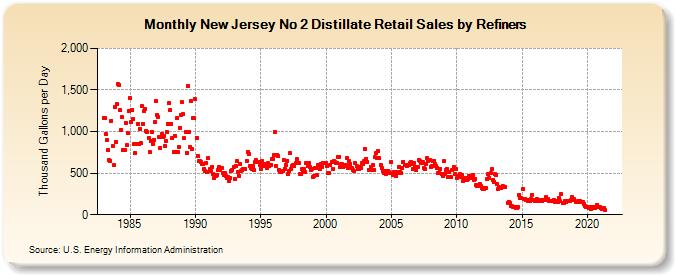
| New Jersey No 2 Distillate Retail Sales by Refiners (Thousand Gallons per Day) | ||||||||
| Year | Jan | Feb | Mar | Apr | May | Jun | Jul | Aug | Sep | Oct | Nov | Dec |
|---|---|---|---|---|---|---|---|---|---|---|---|---|
| 1983 | 1,164.3 | 1,160.3 | 965.5 | 899.2 | 773.3 | 660.7 | 646.6 | 1,130.9 | 827.3 | 593.9 | 1,293.3 | 871.5 |
| 1984 | 1,327.1 | 1,568.0 | 1,553.8 | 1,261.1 | 1,015.7 | 1,171.4 | 781.4 | 780.9 | 1,107.8 | 834.8 | 979.3 | 1,249.4 |
| 1985 | 1,406.1 | 1,117.6 | 1,256.4 | 1,148.6 | 846.5 | 740.3 | 844.8 | 1,091.6 | 846.1 | 1,035.5 | 860.9 | 1,306.6 |
| 1986 | 1,092.5 | 1,242.1 | 1,268.2 | 1,010.3 | 997.3 | 923.9 | 759.5 | 887.3 | 997.7 | 853.9 | 903.8 | 1,112.4 |
| 1987 | 1,366.8 | 1,204.0 | 1,180.6 | 931.0 | 807.1 | 971.6 | 933.5 | 949.7 | 831.7 | 887.0 | 989.8 | 1,094.1 |
| 1988 | 1,338.8 | 1,257.7 | 1,093.3 | 924.1 | 753.6 | 950.9 | 755.8 | 1,161.0 | 756.6 | 813.3 | 1,046.3 | 1,201.5 |
| 1989 | 1,350.2 | 1,209.5 | 917.3 | 995.5 | 747.5 | 1,552.7 | 988.8 | 811.7 | 1,361.8 | 794.0 | 1,159.5 | 1,161.5 |
| 1990 | 1,387.7 | 926.5 | 709.8 | 640.6 | 640.5 | 638.9 | 609.4 | 613.9 | 550.9 | 526.5 | 625.9 | 517.3 |
| 1991 | 676.7 | 545.2 | 526.5 | 569.4 | 485.6 | 438.6 | 472.2 | 469.3 | 482.7 | 535.2 | 574.2 | 543.6 |
| 1992 | 563.2 | 499.0 | 475.2 | 500.3 | 470.4 | 443.6 | 458.1 | 399.5 | 437.7 | 523.2 | 536.2 | 575.2 |
| 1993 | 431.5 | 587.3 | 642.7 | 510.2 | 469.2 | 613.2 | 521.8 | 535.3 | 551.6 | 554.6 | 546.9 | 648.9 |
| 1994 | 751.4 | 735.1 | 588.0 | 561.5 | 553.0 | 580.3 | 537.3 | 630.0 | 657.9 | 632.8 | 633.5 | 602.6 |
| 1995 | 554.3 | 649.8 | 593.0 | 584.4 | 604.9 | 598.4 | 561.7 | 621.2 | 582.7 | 592.6 | 666.1 | 674.3 |
| 1996 | 712.3 | 999.7 | 589.5 | 717.0 | 705.4 | 541.0 | 508.0 | 511.0 | 521.9 | 659.9 | 554.4 | 593.1 |
| 1997 | 651.9 | 485.1 | 522.1 | 737.2 | 543.8 | 589.4 | 594.1 | 580.9 | 618.4 | 666.6 | 617.2 | 621.0 |
| 1998 | 491.6 | 492.9 | 544.2 | 515.1 | 544.1 | 511.6 | 622.6 | 583.2 | 625.4 | 569.9 | 542.4 | 555.4 |
| 1999 | 454.3 | 466.0 | 565.2 | 562.2 | 472.2 | 598.2 | 552.6 | 615.0 | 575.5 | 622.1 | 617.1 | 624.6 |
| 2000 | 626.5 | 580.4 | 506.5 | 495.8 | 601.8 | 633.6 | 547.6 | 648.1 | 639.5 | 625.7 | 620.7 | 690.1 |
| 2001 | 698.2 | 576.6 | 607.8 | 605.9 | 568.4 | 583.1 | 603.3 | 680.5 | 565.9 | 647.5 | 610.6 | 564.0 |
| 2002 | 560.5 | 535.0 | 519.8 | 616.3 | 581.5 | 551.8 | 552.0 | 573.1 | 559.6 | 622.6 | 608.2 | 641.9 |
| 2003 | 794.9 | 670.9 | 635.3 | 541.2 | 538.3 | 579.5 | 543.6 | 602.9 | 539.8 | 690.4 | 742.8 | 687.7 |
| 2004 | 768.8 | 677.7 | 599.7 | 557.7 | 525.5 | 503.0 | 525.4 | 487.5 | 528.2 | 523.7 | 512.9 | 501.7 |
| 2005 | 636.8 | 471.9 | 510.1 | 486.5 | 470.2 | 507.7 | 498.5 | 578.3 | 519.6 | 501.7 | 566.2 | 638.9 |
| 2006 | 601.6 | 595.1 | 588.1 | 598.0 | 593.5 | 619.2 | 634.0 | 612.2 | 548.7 | 622.9 | 568.9 | 532.1 |
| 2007 | 571.5 | 655.9 | 643.0 | 627.8 | 625.7 | 629.2 | 557.0 | 554.5 | 611.5 | 678.3 | 644.4 | 655.1 |
| 2008 | 577.1 | 591.7 | 643.2 | 650.4 | 613.4 | 588.3 | 565.4 | 498.9 | 507.0 | 549.6 | 488.4 | 468.5 |
| 2009 | 640.3 | 495.2 | 536.4 | 553.7 | 459.3 | 511.9 | 455.0 | 448.0 | 534.0 | 574.7 | 484.6 | 554.0 |
| 2010 | 436.4 | 459.9 | 454.5 | 485.7 | 452.2 | 478.8 | 409.8 | 434.1 | 446.5 | 418.4 | 425.0 | 468.4 |
| 2011 | 455.6 | 439.2 | 465.7 | 474.6 | 417.7 | 434.5 | 358.7 | 349.0 | 342.0 | 370.9 | 343.5 | 317.0 |
| 2012 | 306.5 | 312.1 | 317.2 | 316.5 | 424.9 | 483.7 | 446.5 | 498.9 | 544.1 | 421.7 | 397.9 | 484.0 |
| 2013 | 483.4 | 365.3 | 311.8 | 327.5 | 324.8 | 322.0 | 342.0 | 330.7 | 336.8 | NA | NA | 136.0 |
| 2014 | 156.6 | 144.1 | 108.0 | 104.3 | 96.9 | 93.4 | 84.4 | 85.1 | 88.7 | 240.2 | 196.1 | 200.0 |
| 2015 | W | 308.7 | 187.1 | 186.8 | 180.8 | 170.0 | 171.4 | 169.3 | 186.7 | 240.8 | 178.4 | 176.9 |
| 2016 | 164.7 | 171.9 | 185.2 | 162.8 | 165.0 | 175.6 | 167.3 | 176.4 | 172.5 | 180.8 | 211.5 | 178.4 |
| 2017 | 188.1 | 168.8 | 163.9 | 165.0 | 167.0 | 180.2 | 156.7 | 152.2 | 170.5 | 153.2 | 203.6 | 160.6 |
| 2018 | 244.3 | 140.8 | 144.3 | 159.8 | 147.9 | 164.3 | 160.9 | 169.6 | 170.3 | 173.6 | 212.7 | 179.5 |
| 2019 | 185.9 | 149.6 | 147.8 | 163.8 | 154.5 | 164.6 | 158.8 | 158.0 | 148.9 | 128.2 | 100.0 | 89.5 |
| 2020 | 91.5 | 86.6 | 96.6 | 70.6 | 82.5 | 90.7 | 81.3 | 83.6 | 87.3 | 122.4 | 88.5 | 91.5 |
| 2021 | 74.9 | 71.0 | 74.7 | 79.4 | 61.4 | W | W | W | W | W | W | W |
| 2022 | W | W | W | |||||||||
| - = No Data Reported; -- = Not Applicable; NA = Not Available; W = Withheld to avoid disclosure of individual company data. |
| Release Date: 6/1/2022 |
| Next Release Date: TBD |