|
Download Data (XLS File) |
|
||||||||
|
||||||||
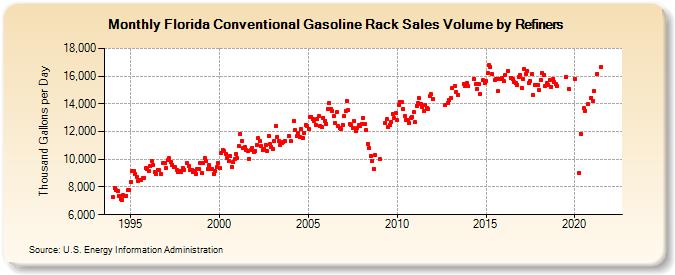
| Florida Conventional Gasoline Rack Sales Volume by Refiners (Thousand Gallons per Day) | ||||||||
| Year | Jan | Feb | Mar | Apr | May | Jun | Jul | Aug | Sep | Oct | Nov | Dec |
|---|---|---|---|---|---|---|---|---|---|---|---|---|
| 1994 | 7,259.8 | 7,916.5 | 7,763.0 | 7,680.4 | 7,380.3 | 7,119.8 | 7,092.4 | 7,417.4 | 7,365.7 | 7,379.4 | 7,755.4 | 7,779.6 |
| 1995 | 8,384.9 | 9,180.9 | 9,166.2 | 8,929.4 | 8,707.2 | 8,452.7 | 8,503.3 | 8,510.8 | 8,625.4 | 8,671.5 | 9,336.2 | 9,305.6 |
| 1996 | 9,167.6 | 9,540.9 | 9,890.6 | 9,605.3 | 9,066.3 | 8,950.9 | 9,249.4 | 9,210.0 | 8,943.2 | W | 9,748.8 | 9,713.8 |
| 1997 | 9,370.3 | 9,917.4 | 10,057.1 | 9,837.5 | 9,592.6 | 9,418.5 | 9,418.0 | 9,250.4 | 9,068.7 | 9,167.6 | 9,073.0 | 9,392.9 |
| 1998 | 9,260.0 | W | 9,710.6 | 9,536.6 | 9,209.5 | 9,193.6 | 9,059.3 | 9,126.2 | 8,969.8 | 9,269.5 | 9,294.6 | 9,723.4 |
| 1999 | 9,005.1 | 9,705.0 | 10,083.7 | 9,866.4 | 9,293.9 | 9,557.1 | 9,292.2 | 9,296.9 | 8,950.9 | 9,150.9 | 9,416.6 | 9,754.1 |
| 2000 | 9,369.5 | 10,427.9 | 10,674.7 | 10,604.1 | 10,367.0 | 10,071.6 | 9,848.4 | 10,264.0 | 9,425.1 | 9,767.4 | 10,010.4 | 10,415.1 |
| 2001 | 10,085.4 | 10,940.3 | 11,825.7 | 11,302.6 | 10,815.2 | 10,869.3 | 10,666.9 | 10,616.8 | 10,007.9 | 10,657.9 | 10,817.9 | 10,542.2 |
| 2002 | 10,586.6 | 11,062.1 | 11,512.3 | 11,353.1 | 10,971.1 | 10,667.1 | 10,748.5 | 11,062.5 | 10,632.2 | 11,681.8 | 11,071.5 | 10,917.7 |
| 2003 | 10,771.9 | 11,315.6 | 12,424.3 | 11,616.5 | 11,320.9 | 11,053.9 | 11,196.4 | 11,257.6 | 11,310.0 | W | W | 11,714.9 |
| 2004 | 11,287.4 | W | 12,790.6 | 12,135.0 | 11,646.4 | 11,924.4 | 11,635.7 | 12,155.8 | 11,529.6 | 11,925.6 | 12,475.4 | 12,402.5 |
| 2005 | 12,181.2 | 13,027.2 | 13,070.8 | 12,915.4 | 12,787.8 | 12,470.6 | 12,911.0 | 13,098.5 | 12,427.5 | 12,295.1 | 13,006.0 | 12,788.6 |
| 2006 | 12,557.5 | 13,651.6 | 14,025.8 | 13,646.3 | 13,501.3 | 13,111.9 | 12,624.1 | 13,391.5 | 12,387.3 | 12,252.5 | 12,218.8 | 12,505.5 |
| 2007 | 13,108.9 | 13,465.8 | 14,203.0 | 13,524.3 | 12,561.7 | 12,471.9 | 12,285.2 | 12,751.5 | 12,010.8 | 12,279.7 | 12,440.7 | 12,366.5 |
| 2008 | 12,512.4 | 12,969.9 | 12,570.8 | 12,142.8 | 11,113.7 | 10,806.3 | 10,240.2 | 9,891.1 | 9,325.1 | 10,317.5 | W | W |
| 2009 | 9,989.3 | W | W | W | 12,629.7 | 12,869.7 | 12,309.5 | 12,483.5 | 12,720.7 | 13,300.1 | 13,012.6 | 13,305.9 |
| 2010 | 12,817.7 | 13,934.4 | 14,100.7 | 14,101.3 | 13,639.6 | 13,132.1 | 12,843.7 | 12,830.8 | 12,636.2 | 12,951.2 | 13,057.5 | 13,411.6 |
| 2011 | 12,667.6 | 13,876.1 | 14,029.1 | 14,392.2 | 13,973.1 | 13,737.5 | 13,448.6 | 13,934.8 | 13,704.3 | 13,659.1 | 14,531.6 | 14,675.9 |
| 2012 | 14,358.6 | W | W | W | W | W | W | W | 13,906.7 | W | 14,036.3 | 14,295.2 |
| 2013 | 14,399.1 | 15,141.3 | W | 15,298.8 | 14,888.0 | 14,625.3 | W | W | W | 15,452.8 | 15,321.8 | 15,524.6 |
| 2014 | 15,258.6 | W | W | W | 15,808.8 | 15,411.6 | 15,093.7 | 15,456.4 | 14,738.5 | W | 15,713.0 | 15,477.6 |
| 2015 | 15,641.6 | 16,224.6 | 16,794.3 | 16,659.5 | 16,143.7 | W | 15,722.9 | 15,777.8 | 14,894.2 | 15,782.3 | 15,792.1 | 15,842.2 |
| 2016 | 15,626.6 | 16,104.2 | W | 16,372.3 | W | 15,894.9 | 15,756.3 | 15,541.7 | 15,471.6 | 15,392.2 | 15,955.8 | 16,091.0 |
| 2017 | 15,178.3 | 15,795.4 | 16,491.0 | 16,178.4 | 16,385.5 | 15,502.1 | 15,642.9 | 16,182.4 | 14,652.7 | 15,383.0 | 15,392.5 | 15,349.3 |
| 2018 | 14,971.8 | 15,737.4 | 16,247.5 | 16,109.8 | 15,313.0 | 15,479.0 | 15,387.8 | 15,714.0 | 15,239.1 | 15,770.3 | 15,597.1 | 15,396.2 |
| 2019 | 15,279.0 | W | W | W | W | W | 15,947.3 | W | 15,100.9 | W | W | W |
| 2020 | 15,796.5 | W | W | 9,019.4 | 11,853.1 | W | 13,678.0 | 13,508.1 | W | 13,955.1 | W | 14,453.4 |
| 2021 | 14,209.0 | 14,960.3 | W | 16,182.6 | W | W | 16,664.6 | W | W | W | W | W |
| 2022 | W | W | W | |||||||||
| - = No Data Reported; -- = Not Applicable; NA = Not Available; W = Withheld to avoid disclosure of individual company data. |
| Release Date: 6/1/2022 |
| Next Release Date: TBD |