|
Download Data (XLS File) |
|
||||||||
|
||||||||
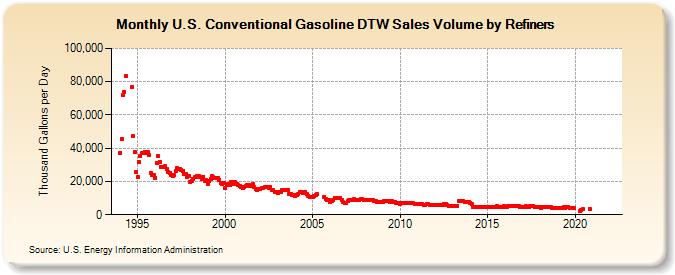
| U.S. Conventional Gasoline DTW Sales Volume by Refiners (Thousand Gallons per Day) | ||||||||
| Year | Jan | Feb | Mar | Apr | May | Jun | Jul | Aug | Sep | Oct | Nov | Dec |
|---|---|---|---|---|---|---|---|---|---|---|---|---|
| 1994 | 37,267.0 | 45,582.9 | 72,123.0 | 73,945.7 | 83,246.0 | W | W | W | 76,619.9 | 47,611.3 | 37,735.7 | 25,588.5 |
| 1995 | 22,860.9 | 31,625.2 | 35,012.6 | 36,827.8 | 37,319.3 | 37,954.3 | 37,033.2 | 37,931.4 | 35,900.2 | 25,352.2 | 24,032.2 | 23,999.5 |
| 1996 | 22,353.2 | 31,066.3 | 35,134.3 | 31,715.8 | 28,743.2 | 28,592.7 | 28,910.5 | 29,109.8 | 27,431.5 | 25,455.0 | 24,792.4 | 23,707.5 |
| 1997 | 23,193.9 | 24,062.8 | 25,985.0 | 27,895.8 | 27,401.6 | 27,402.2 | 26,797.8 | 26,510.8 | 24,745.8 | 24,358.2 | 22,874.1 | 23,120.2 |
| 1998 | 19,370.8 | 20,433.1 | 21,474.3 | 22,519.1 | 22,890.9 | 23,252.4 | 23,236.5 | 22,891.5 | 21,561.1 | 22,838.8 | 20,352.1 | 20,656.5 |
| 1999 | 18,450.2 | 20,174.0 | 21,255.9 | 23,410.4 | 22,504.7 | 22,350.8 | 22,318.9 | 22,290.6 | 21,105.9 | 18,785.4 | 18,182.4 | 19,115.3 |
| 2000 | 16,031.8 | 17,846.4 | 18,173.2 | 18,126.7 | 19,619.8 | 19,835.2 | 18,683.8 | 19,461.9 | 18,753.1 | 17,579.5 | 17,120.3 | 16,946.9 |
| 2001 | 15,763.1 | 16,441.7 | 17,023.4 | 17,745.2 | 17,746.0 | 17,359.0 | 17,050.8 | 18,270.4 | 16,436.9 | 15,454.3 | 14,930.0 | 15,568.4 |
| 2002 | 15,272.1 | 15,798.6 | 16,210.0 | 16,527.2 | 16,596.6 | 16,464.4 | 16,181.6 | 16,617.0 | 14,918.1 | 14,659.8 | 13,568.5 | 13,390.5 |
| 2003 | 13,345.2 | 13,683.9 | 13,796.1 | 14,623.8 | 14,559.3 | 14,679.7 | 14,806.8 | 14,875.5 | 12,680.1 | 12,305.0 | 11,636.9 | 11,771.0 |
| 2004 | 11,440.7 | 12,126.3 | 12,303.6 | 13,479.2 | 13,539.0 | 12,833.9 | 13,429.6 | 13,448.5 | 12,324.6 | 11,365.4 | 10,602.3 | 10,660.9 |
| 2005 | 10,591.4 | 11,241.7 | 11,765.9 | 12,353.7 | W | W | W | W | 10,634.1 | 9,351.6 | 8,923.5 | 8,958.2 |
| 2006 | 7,906.7 | 8,222.2 | 8,584.3 | 10,029.8 | 9,770.2 | 10,342.9 | 10,277.8 | 9,918.0 | 8,742.0 | 7,386.8 | 7,308.0 | 7,136.2 |
| 2007 | 8,384.5 | 8,817.2 | 8,850.7 | 9,096.1 | 9,231.2 | 8,981.7 | 8,849.5 | 8,993.0 | 8,782.5 | 9,332.5 | 9,227.8 | 9,080.9 |
| 2008 | 8,658.8 | 9,019.9 | 9,003.1 | 9,105.4 | 8,807.6 | 8,555.2 | 8,438.7 | 8,264.7 | 7,940.0 | 7,744.5 | 7,613.7 | 7,405.9 |
| 2009 | 7,825.5 | 8,285.9 | 8,170.9 | 8,316.1 | 8,344.1 | 7,923.5 | 7,986.0 | 7,918.7 | 7,540.4 | 7,318.8 | 6,820.6 | 6,936.3 |
| 2010 | 6,309.6 | 6,887.4 | 6,763.9 | 7,065.6 | 7,140.8 | 7,175.9 | 7,206.2 | 7,046.8 | 6,884.1 | 6,887.3 | 6,660.4 | 6,731.0 |
| 2011 | 6,240.2 | 6,428.1 | 6,481.5 | 6,353.3 | 6,034.1 | 6,033.2 | 6,211.2 | 6,167.1 | 5,980.0 | 6,069.4 | 6,035.6 | 6,034.3 |
| 2012 | 5,645.5 | 5,919.3 | 5,970.1 | 5,855.3 | 6,077.7 | 6,079.5 | 6,279.3 | 6,345.2 | 5,988.6 | 5,233.7 | 5,200.1 | 5,135.2 |
| 2013 | 5,170.1 | 5,219.6 | 5,230.4 | 5,375.4 | 8,142.8 | 8,275.5 | 8,224.6 | 8,420.4 | 7,846.2 | 7,770.3 | 7,893.7 | 7,647.3 |
| 2014 | 7,248.7 | 6,499.9 | 4,676.9 | 4,642.5 | 4,767.6 | 4,782.2 | 4,889.7 | 4,919.2 | 4,671.6 | 4,732.7 | 4,648.2 | 4,687.0 |
| 2015 | 4,478.0 | 4,698.1 | 4,725.4 | 4,720.7 | 4,728.5 | 4,919.3 | 4,954.1 | 4,876.1 | 4,727.8 | 4,844.9 | 4,926.8 | 4,982.5 |
| 2016 | 4,818.4 | 4,934.7 | 5,025.3 | 5,123.9 | 5,157.2 | 5,202.5 | 5,145.3 | 5,243.9 | 5,052.0 | 4,949.7 | 4,822.6 | 4,817.9 |
| 2017 | 4,510.3 | 4,659.9 | 4,957.4 | 4,841.5 | 4,901.9 | 4,941.8 | 4,948.7 | 4,983.5 | 4,724.9 | 4,714.7 | 4,377.0 | 4,442.6 |
| 2018 | 4,276.4 | 4,393.8 | 4,507.0 | 4,413.1 | 4,369.6 | 4,431.2 | 4,536.5 | 4,521.5 | 4,266.3 | 4,274.1 | 4,232.0 | 4,197.8 |
| 2019 | 3,888.3 | 4,041.3 | 4,319.3 | 4,253.8 | 4,343.5 | 4,337.0 | 4,381.2 | 4,490.9 | 4,165.6 | 4,212.3 | 4,072.5 | 4,025.6 |
| 2020 | W | W | W | 2,135.7 | 2,921.5 | 3,400.9 | W | W | W | W | 3,160.3 | W |
| 2021 | W | W | W | W | W | W | W | W | W | W | W | W |
| 2022 | W | W | W | |||||||||
| - = No Data Reported; -- = Not Applicable; NA = Not Available; W = Withheld to avoid disclosure of individual company data. |
| Release Date: 6/1/2022 |
| Next Release Date: TBD |