|
Download Data (XLS File) |
|
||||||||
|
||||||||
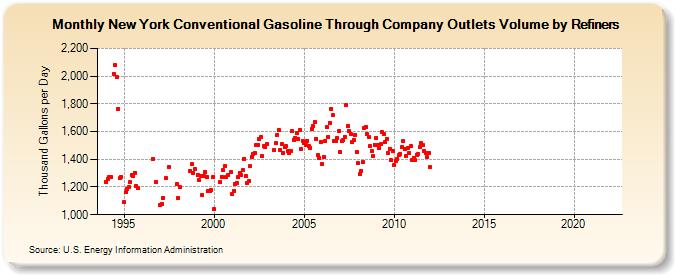
| New York Conventional Gasoline Through Company Outlets Volume by Refiners (Thousand Gallons per Day) | ||||||||
| Year | Jan | Feb | Mar | Apr | May | Jun | Jul | Aug | Sep | Oct | Nov | Dec |
|---|---|---|---|---|---|---|---|---|---|---|---|---|
| 1994 | 1,237.9 | 1,260.4 | 1,268.9 | 1,272.7 | W | 2,018.3 | 2,078.7 | 1,994.5 | 1,763.4 | 1,261.4 | 1,273.4 | W |
| 1995 | 1,091.0 | 1,161.3 | 1,185.6 | 1,197.8 | 1,232.5 | 1,290.0 | 1,276.2 | 1,303.0 | 1,209.7 | 1,194.2 | W | W |
| 1996 | W | W | W | W | W | W | W | 1,402.3 | W | 1,234.7 | W | W |
| 1997 | 1,070.5 | 1,079.2 | 1,120.5 | W | 1,264.2 | W | 1,345.8 | W | W | W | W | 1,221.5 |
| 1998 | 1,123.2 | 1,199.5 | W | W | W | W | W | W | 1,317.3 | 1,363.5 | 1,303.7 | 1,332.3 |
| 1999 | W | 1,285.7 | 1,251.5 | 1,279.1 | 1,139.5 | 1,279.7 | 1,307.6 | 1,273.1 | 1,169.5 | 1,174.7 | 1,179.0 | 1,269.1 |
| 2000 | 1,039.3 | W | W | W | 1,235.0 | 1,274.1 | 1,319.6 | 1,348.4 | 1,269.4 | 1,284.5 | W | 1,306.2 |
| 2001 | 1,152.5 | 1,172.8 | 1,224.8 | 1,229.9 | 1,275.5 | 1,300.8 | 1,285.3 | 1,320.2 | 1,404.4 | 1,278.8 | 1,232.1 | 1,242.7 |
| 2002 | 1,348.6 | 1,416.4 | 1,436.9 | 1,445.9 | 1,502.3 | 1,500.0 | 1,548.5 | 1,560.3 | 1,421.4 | 1,496.9 | 1,488.5 | 1,508.5 |
| 2003 | W | W | W | W | 1,467.8 | 1,515.8 | 1,577.5 | 1,610.7 | 1,464.8 | 1,511.4 | 1,444.0 | 1,486.2 |
| 2004 | 1,493.5 | 1,456.5 | 1,444.4 | 1,459.3 | 1,603.4 | 1,541.1 | 1,556.7 | 1,588.4 | 1,549.7 | 1,608.7 | 1,471.7 | 1,532.8 |
| 2005 | 1,516.5 | 1,506.4 | 1,532.4 | 1,495.1 | 1,483.7 | 1,618.8 | 1,639.4 | 1,667.0 | 1,549.3 | 1,428.2 | 1,406.6 | 1,525.7 |
| 2006 | 1,369.4 | 1,419.9 | 1,531.3 | 1,633.2 | 1,561.7 | 1,665.2 | 1,765.8 | 1,716.4 | 1,533.9 | 1,532.6 | 1,553.8 | 1,602.1 |
| 2007 | 1,453.3 | 1,529.4 | 1,537.1 | 1,563.7 | 1,789.1 | 1,640.5 | 1,600.8 | 1,580.8 | 1,522.3 | 1,541.2 | 1,578.6 | 1,452.7 |
| 2008 | 1,371.0 | 1,294.2 | 1,317.5 | 1,378.4 | 1,628.2 | 1,630.6 | 1,579.4 | 1,560.8 | 1,496.2 | 1,460.2 | 1,420.7 | 1,505.1 |
| 2009 | 1,553.0 | 1,502.4 | 1,479.3 | 1,509.5 | 1,594.2 | 1,584.4 | 1,527.6 | 1,549.2 | 1,445.9 | 1,476.2 | 1,392.9 | 1,458.0 |
| 2010 | 1,359.1 | 1,390.4 | 1,402.9 | 1,428.7 | 1,439.3 | 1,488.0 | 1,529.3 | 1,471.6 | 1,422.4 | 1,481.7 | 1,445.8 | 1,496.7 |
| 2011 | 1,393.9 | 1,409.4 | 1,394.5 | 1,432.7 | 1,440.3 | 1,486.4 | 1,515.1 | 1,500.5 | 1,462.8 | 1,446.2 | 1,413.9 | 1,447.8 |
| 2012 | 1,342.0 | W | W | W | W | W | W | W | W | W | W | W |
| 2013 | W | W | W | W | W | W | W | W | W | W | W | W |
| 2014 | W | W | W | W | W | W | W | W | W | W | W | W |
| 2015 | W | W | W | W | W | W | W | W | W | W | W | W |
| 2016 | W | W | W | W | W | W | W | W | W | W | W | W |
| 2017 | W | W | W | W | W | W | W | W | W | W | W | W |
| 2018 | W | W | W | W | W | W | W | W | W | W | W | W |
| 2019 | W | W | W | W | W | W | W | W | W | W | W | W |
| 2020 | W | W | W | W | W | W | W | W | W | W | W | W |
| 2021 | W | W | W | W | W | W | W | W | W | W | W | W |
| 2022 | W | W | W | |||||||||
| - = No Data Reported; -- = Not Applicable; NA = Not Available; W = Withheld to avoid disclosure of individual company data. |
| Release Date: 6/1/2022 |
| Next Release Date: TBD |