|
Download Data (XLS File) |
|
||||||||
|
||||||||
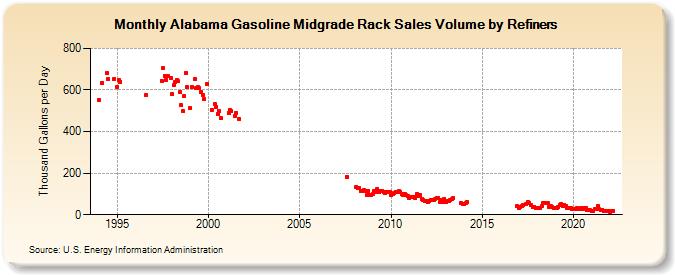
| Alabama Gasoline Midgrade Rack Sales Volume by Refiners (Thousand Gallons per Day) | ||||||||
| Year | Jan | Feb | Mar | Apr | May | Jun | Jul | Aug | Sep | Oct | Nov | Dec |
|---|---|---|---|---|---|---|---|---|---|---|---|---|
| 1994 | 551.9 | W | 634.8 | W | W | 681.3 | 653.3 | W | W | W | 654.4 | W |
| 1995 | 615.0 | 647.9 | 639.8 | W | W | W | W | W | W | W | W | W |
| 1996 | W | W | W | W | W | W | W | 576.8 | W | W | W | W |
| 1997 | W | W | W | W | W | 644.3 | 703.8 | 667.4 | 649.8 | 665.2 | W | 657.8 |
| 1998 | 580.6 | 621.9 | 636.9 | 647.9 | 642.2 | 589.6 | 526.3 | 496.5 | 570.5 | 683.5 | 615.2 | W |
| 1999 | 514.4 | 614.3 | W | 651.4 | 610.3 | 614.1 | 609.1 | 589.1 | 576.4 | 554.9 | W | 630.5 |
| 2000 | W | W | 506.0 | W | 532.5 | 519.3 | 486.5 | 497.2 | 464.4 | W | W | W |
| 2001 | W | 491.6 | 506.0 | 497.7 | W | 475.1 | 491.2 | W | 460.9 | W | W | W |
| 2002 | W | W | W | W | W | W | W | W | W | W | W | W |
| 2003 | W | W | W | W | W | W | W | W | W | W | W | W |
| 2004 | W | W | W | W | W | W | W | W | W | W | W | W |
| 2005 | W | W | W | W | W | W | W | W | W | W | W | W |
| 2006 | W | W | W | W | W | W | W | W | W | W | W | W |
| 2007 | W | W | W | W | W | W | W | 183.1 | W | W | W | W |
| 2008 | W | 130.9 | 126.4 | 128.4 | 115.9 | 114.5 | 118.1 | 113.5 | 94.0 | 115.0 | 95.9 | 94.6 |
| 2009 | 98.8 | 113.1 | 109.1 | 121.8 | 108.4 | 113.7 | 115.8 | 110.3 | 102.6 | 109.9 | 109.8 | 108.3 |
| 2010 | 95.5 | 101.5 | 105.3 | 111.6 | 107.1 | 112.1 | 110.9 | 101.3 | 97.0 | 98.3 | 92.9 | 90.8 |
| 2011 | 78.3 | 83.2 | 85.8 | 87.2 | 81.3 | 102.0 | 88.6 | 93.2 | 76.8 | 71.4 | 67.7 | 67.4 |
| 2012 | 59.3 | 65.3 | 70.8 | 70.8 | 72.8 | 77.4 | 79.6 | 81.2 | 63.1 | 71.8 | 63.5 | 76.3 |
| 2013 | 62.9 | 63.6 | 68.3 | 71.1 | 73.6 | 79.6 | W | W | W | W | 57.6 | 53.8 |
| 2014 | 53.2 | 54.6 | 60.5 | W | W | W | W | W | W | W | W | W |
| 2015 | W | W | W | W | W | W | W | W | W | W | W | W |
| 2016 | W | W | W | W | W | W | W | W | W | W | W | 41.6 |
| 2017 | 34.7 | 37.1 | 40.3 | 44.7 | NA | 51.9 | 60.2 | 57.1 | 47.5 | 36.3 | 39.2 | 34.5 |
| 2018 | 34.4 | 34.4 | 30.6 | 41.2 | 56.7 | 54.5 | 58.4 | 54.9 | 39.2 | 42.9 | 35.0 | 30.3 |
| 2019 | 32.8 | 34.1 | 36.0 | 44.7 | 51.1 | 42.8 | 48.9 | 42.9 | 34.3 | 33.5 | 31.3 | 27.8 |
| 2020 | 27.8 | 27.4 | 30.7 | 27.5 | 29.7 | 30.0 | 29.6 | 31.0 | 30.9 | 22.2 | 20.7 | 20.4 |
| 2021 | 19.8 | 19.3 | 25.8 | 27.2 | 42.4 | 25.1 | 22.8 | 25.0 | 18.6 | 19.1 | 17.9 | 17.6 |
| 2022 | 14.6 | 17.0 | 18.2 | |||||||||
| - = No Data Reported; -- = Not Applicable; NA = Not Available; W = Withheld to avoid disclosure of individual company data. |
| Release Date: 6/1/2022 |
| Next Release Date: TBD |