|
Download Data (XLS File) |
|
||||||||
|
||||||||
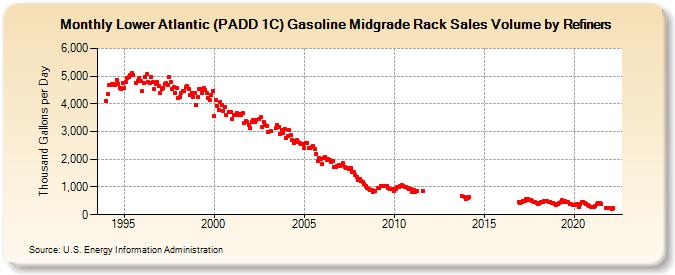
| Lower Atlantic (PADD 1C) Gasoline Midgrade Rack Sales Volume by Refiners (Thousand Gallons per Day) | ||||||||
| Year | Jan | Feb | Mar | Apr | May | Jun | Jul | Aug | Sep | Oct | Nov | Dec |
|---|---|---|---|---|---|---|---|---|---|---|---|---|
| 1994 | 4,108.7 | 4,349.0 | 4,691.4 | 4,686.7 | 4,716.8 | 4,731.8 | 4,697.0 | 4,851.7 | 4,726.7 | 4,577.8 | 4,550.3 | 4,765.2 |
| 1995 | 4,554.5 | 4,786.7 | 4,937.4 | 4,960.5 | 5,051.7 | 5,101.5 | 5,037.7 | W | 4,763.2 | 4,837.4 | 4,933.9 | 4,821.9 |
| 1996 | 4,448.0 | 4,759.9 | 4,958.5 | 5,063.3 | 4,774.5 | 4,751.0 | 4,954.4 | 4,791.8 | 4,545.8 | 4,713.2 | 4,797.5 | 4,636.3 |
| 1997 | 4,379.4 | 4,522.4 | 4,578.3 | 4,706.8 | 4,734.5 | 4,666.5 | 4,955.1 | 4,778.3 | 4,546.4 | 4,593.4 | 4,401.1 | 4,585.6 |
| 1998 | 4,192.8 | 4,243.7 | 4,393.4 | 4,475.2 | 4,468.5 | 4,600.1 | 4,651.2 | 4,538.3 | 4,308.5 | 4,407.9 | 4,228.6 | 4,404.9 |
| 1999 | 3,967.0 | 4,234.0 | 4,545.3 | 4,551.1 | 4,376.1 | 4,577.2 | 4,492.5 | 4,401.2 | 4,222.4 | 4,121.9 | 4,321.6 | 4,446.9 |
| 2000 | 3,579.0 | 4,136.5 | 3,924.2 | 3,779.1 | 4,077.5 | 3,953.7 | 3,750.0 | 3,879.5 | 3,585.1 | W | 3,697.9 | 3,695.1 |
| 2001 | 3,444.9 | 3,610.2 | W | 3,675.2 | 3,593.7 | 3,626.1 | 3,607.2 | 3,666.3 | 3,322.4 | 3,389.1 | 3,328.4 | 3,224.3 |
| 2002 | 3,132.9 | 3,328.3 | 3,405.8 | 3,339.6 | 3,424.2 | W | 3,455.9 | 3,513.3 | 3,166.1 | 3,361.6 | 3,251.3 | 3,196.4 |
| 2003 | 2,985.0 | W | 3,014.7 | W | W | 3,134.8 | 3,231.3 | 3,146.9 | 2,921.8 | 3,047.4 | 2,953.2 | 3,090.1 |
| 2004 | 2,761.1 | 2,824.6 | 3,043.0 | 2,882.1 | 2,701.8 | 2,578.8 | 2,643.7 | 2,690.9 | 2,605.1 | 2,574.9 | 2,560.1 | 2,565.1 |
| 2005 | 2,409.0 | 2,578.8 | 2,572.5 | 2,393.9 | 2,420.0 | 2,446.5 | 2,461.5 | 2,387.8 | 2,182.0 | 1,951.4 | 2,029.7 | 2,023.2 |
| 2006 | 1,828.8 | 2,031.1 | 2,094.6 | 1,971.4 | 1,992.6 | 1,962.4 | 1,896.1 | 1,954.5 | 1,737.8 | 1,709.1 | 1,768.8 | 1,794.4 |
| 2007 | 1,763.5 | 1,805.0 | 1,856.5 | 1,731.6 | 1,687.1 | 1,685.6 | 1,648.9 | 1,683.8 | 1,546.1 | 1,553.0 | 1,440.8 | 1,369.7 |
| 2008 | 1,253.5 | 1,288.2 | 1,213.5 | 1,171.1 | 1,122.6 | 1,038.4 | 979.6 | 931.9 | 884.0 | 882.7 | 818.3 | 862.0 |
| 2009 | W | 965.6 | 959.3 | 1,046.6 | W | 1,020.7 | W | 1,030.5 | 957.8 | 936.4 | 929.3 | 942.5 |
| 2010 | 865.2 | 941.5 | 987.2 | 999.8 | 1,029.0 | 1,059.0 | 1,043.3 | 1,014.3 | 984.9 | 966.3 | 936.4 | 920.7 |
| 2011 | 817.1 | 877.9 | 835.2 | 855.4 | W | W | W | 868.1 | W | W | W | W |
| 2012 | W | W | W | W | W | W | W | W | W | W | W | W |
| 2013 | W | W | W | W | W | W | W | W | W | 681.1 | W | 626.2 |
| 2014 | 574.4 | 597.2 | 629.9 | W | W | W | W | W | W | W | W | W |
| 2015 | W | W | W | W | W | W | W | W | W | W | W | W |
| 2016 | W | W | W | W | W | W | W | W | W | W | W | 465.2 |
| 2017 | 419.9 | 451.1 | 480.7 | 484.9 | 556.2 | 558.2 | 540.0 | 532.5 | 499.9 | 455.8 | 458.5 | 430.5 |
| 2018 | 398.3 | 423.0 | 447.2 | 469.2 | 490.4 | 495.0 | 480.1 | 472.5 | 471.7 | 431.1 | 422.7 | 389.0 |
| 2019 | 365.9 | 380.9 | 414.9 | 443.8 | 516.8 | 475.8 | 493.8 | 474.5 | 441.1 | 393.8 | 384.6 | 361.2 |
| 2020 | 353.9 | 340.9 | 383.2 | 287.9 | 390.9 | 449.1 | 470.8 | 419.2 | 378.2 | 339.5 | 312.0 | 294.1 |
| 2021 | 274.8 | 281.3 | 320.9 | 372.3 | 435.7 | 413.0 | 400.0 | W | W | 234.8 | 234.8 | 231.4 |
| 2022 | W | 221.4 | 238.3 | |||||||||
| - = No Data Reported; -- = Not Applicable; NA = Not Available; W = Withheld to avoid disclosure of individual company data. |
| Release Date: 6/1/2022 |
| Next Release Date: TBD |