|
Download Data (XLS File) |
|
||||||||
|
||||||||
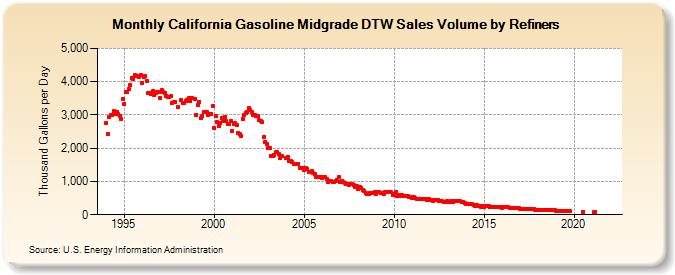
| California Gasoline Midgrade DTW Sales Volume by Refiners (Thousand Gallons per Day) | ||||||||
| Year | Jan | Feb | Mar | Apr | May | Jun | Jul | Aug | Sep | Oct | Nov | Dec |
|---|---|---|---|---|---|---|---|---|---|---|---|---|
| 1994 | 2,754.0 | 2,437.5 | 2,951.9 | 2,991.5 | 3,009.6 | 3,103.5 | 3,033.0 | 3,095.7 | 3,018.1 | 2,968.6 | 2,889.8 | 3,466.5 |
| 1995 | 3,336.2 | 3,681.4 | 3,703.8 | 3,779.8 | 3,889.4 | 4,120.0 | 4,075.6 | 4,187.3 | 4,179.1 | 4,159.4 | 4,152.5 | 4,189.8 |
| 1996 | 3,972.0 | 4,138.1 | 4,170.1 | 4,029.4 | 3,649.9 | 3,647.2 | 3,617.3 | 3,707.3 | 3,604.9 | 3,671.3 | 3,684.1 | 3,700.4 |
| 1997 | 3,500.3 | 3,743.8 | 3,696.0 | 3,672.7 | 3,576.8 | 3,539.5 | 3,544.6 | 3,555.8 | 3,360.4 | 3,394.9 | 3,395.6 | W |
| 1998 | 3,252.3 | W | 3,445.0 | 3,359.4 | 3,373.2 | 3,404.6 | 3,456.7 | 3,496.6 | 3,407.2 | 3,500.5 | W | 3,485.7 |
| 1999 | 3,010.9 | 3,302.4 | 3,399.8 | 2,893.8 | 2,973.9 | 3,094.8 | 3,093.3 | 3,091.5 | 3,009.9 | 3,029.8 | 3,034.3 | 3,265.1 |
| 2000 | 2,610.4 | 2,981.8 | 2,787.6 | 2,679.6 | 2,769.1 | 2,919.2 | 2,817.7 | 2,924.5 | 2,816.5 | 2,732.2 | 2,726.0 | 2,831.3 |
| 2001 | 2,519.4 | 2,723.9 | 2,766.5 | 2,707.9 | 2,463.8 | 2,422.4 | 2,366.5 | 2,872.0 | 3,009.5 | 3,068.4 | 3,086.1 | 3,201.6 |
| 2002 | 3,145.4 | 3,096.0 | 2,989.9 | 2,986.2 | 2,980.7 | 2,960.7 | 2,838.1 | 2,810.1 | 2,776.8 | 2,329.1 | 2,192.0 | 2,111.5 |
| 2003 | 2,020.3 | 1,995.9 | 1,760.0 | 1,763.3 | 1,802.2 | 1,875.9 | 1,887.7 | 1,828.5 | 1,697.8 | 1,759.7 | W | W |
| 2004 | 1,715.4 | 1,737.2 | 1,627.1 | 1,607.6 | 1,593.2 | 1,524.4 | 1,535.6 | 1,532.0 | 1,529.3 | 1,415.5 | 1,393.1 | 1,392.9 |
| 2005 | 1,358.6 | 1,391.4 | 1,372.5 | 1,296.0 | 1,285.1 | 1,310.8 | 1,252.3 | 1,212.3 | 1,136.1 | 1,122.5 | 1,119.9 | 1,133.2 |
| 2006 | 1,090.9 | 1,121.1 | 1,121.5 | 1,064.1 | 993.8 | 1,017.1 | 1,004.8 | 995.8 | 990.6 | 1,013.6 | 1,034.4 | 1,128.9 |
| 2007 | 990.7 | 1,018.9 | 982.5 | 955.0 | 922.9 | 911.0 | 893.3 | 923.0 | 910.2 | 884.2 | 839.3 | 848.9 |
| 2008 | 779.4 | 836.2 | 788.3 | 752.8 | 720.6 | 657.1 | 622.8 | 634.1 | 662.8 | 647.8 | 642.0 | 679.3 |
| 2009 | 633.8 | 677.6 | 682.7 | 650.7 | 649.5 | 607.8 | 697.0 | 695.0 | 681.8 | 680.2 | 668.5 | 580.3 |
| 2010 | 617.7 | 688.4 | 574.9 | 569.8 | 606.3 | 587.1 | 560.8 | 556.7 | 565.8 | 553.0 | 539.1 | 526.6 |
| 2011 | 498.1 | 517.9 | 491.0 | 470.6 | 463.4 | 473.8 | 473.8 | 480.7 | 460.9 | 458.6 | 444.0 | 462.1 |
| 2012 | 434.4 | 450.2 | 424.9 | 432.2 | 430.5 | 437.7 | 422.3 | 416.5 | 410.5 | 388.9 | 396.4 | 398.4 |
| 2013 | 394.5 | 385.9 | 403.2 | 395.6 | 418.3 | 414.2 | 401.2 | 413.9 | 399.3 | 396.3 | 388.9 | 366.3 |
| 2014 | 324.1 | 333.0 | 322.5 | 311.7 | 313.7 | 305.5 | 271.5 | 284.4 | 256.3 | 255.4 | 242.4 | 248.6 |
| 2015 | 241.3 | 250.8 | 249.1 | 247.7 | 237.2 | 237.7 | 220.7 | 227.9 | 226.7 | 228.0 | 220.6 | 222.5 |
| 2016 | 212.0 | 220.7 | 217.8 | 223.1 | 221.9 | 215.5 | 213.2 | 213.0 | 205.9 | 201.9 | 192.4 | 188.7 |
| 2017 | 175.8 | 180.1 | 185.2 | 181.0 | 178.3 | 176.2 | 168.8 | 170.4 | 161.2 | 162.7 | 149.6 | 153.5 |
| 2018 | 142.0 | 146.6 | 147.5 | 154.1 | 147.4 | 145.7 | 151.5 | 145.1 | 138.0 | 134.9 | 129.3 | 128.6 |
| 2019 | 117.9 | 125.6 | 120.2 | 126.5 | 120.1 | 120.7 | 116.6 | 120.4 | 117.9 | 112.0 | W | W |
| 2020 | W | W | W | W | W | W | 83.7 | W | W | W | W | W |
| 2021 | W | 73.6 | 75.5 | W | W | W | W | W | W | W | W | W |
| 2022 | W | W | W | |||||||||
| - = No Data Reported; -- = Not Applicable; NA = Not Available; W = Withheld to avoid disclosure of individual company data. |
| Release Date: 6/1/2022 |
| Next Release Date: TBD |