|
Download Data (XLS File) |
|
||||||||
|
||||||||
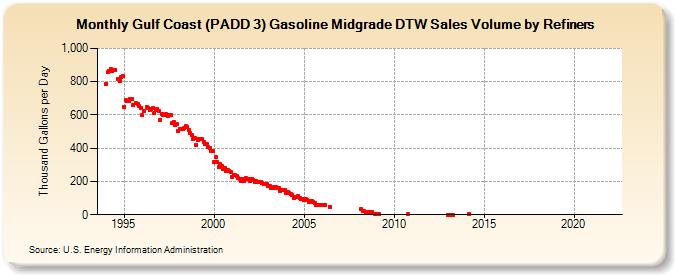
| Gulf Coast (PADD 3) Gasoline Midgrade DTW Sales Volume by Refiners (Thousand Gallons per Day) | ||||||||
| Year | Jan | Feb | Mar | Apr | May | Jun | Jul | Aug | Sep | Oct | Nov | Dec |
|---|---|---|---|---|---|---|---|---|---|---|---|---|
| 1994 | 786.7 | 855.9 | 865.8 | 875.3 | 863.4 | 867.7 | 871.1 | W | 818.4 | 801.8 | 825.4 | 832.9 |
| 1995 | 650.4 | 689.1 | 683.1 | 685.5 | 696.5 | 693.1 | 661.5 | W | 673.8 | 668.2 | 651.5 | 643.5 |
| 1996 | 600.3 | 621.6 | W | 647.3 | 640.4 | 629.3 | 634.4 | 639.5 | 614.5 | 631.5 | 634.1 | 625.7 |
| 1997 | 572.1 | 605.8 | 599.5 | 601.0 | 603.0 | 595.0 | 597.8 | 600.7 | 552.4 | 557.5 | 541.7 | 543.1 |
| 1998 | 505.4 | 517.1 | 518.0 | 516.7 | 523.9 | 532.0 | 526.6 | 511.2 | 488.6 | 477.1 | 457.3 | 459.7 |
| 1999 | 416.8 | 449.5 | 454.0 | 454.2 | 452.6 | 440.0 | 422.9 | 422.5 | 404.5 | 403.2 | 385.6 | 381.7 |
| 2000 | 317.0 | 349.6 | 318.1 | 287.6 | 303.8 | 292.9 | 275.7 | 282.4 | 265.5 | 266.0 | 264.9 | 256.9 |
| 2001 | 229.7 | 239.4 | 236.1 | 234.4 | 220.3 | 214.7 | 202.1 | 215.5 | 201.3 | 217.9 | 214.4 | 214.5 |
| 2002 | 203.0 | 217.0 | 209.2 | 196.8 | 204.4 | 197.2 | 194.9 | 194.5 | 189.0 | 187.1 | 185.4 | 183.5 |
| 2003 | 171.9 | 170.8 | 163.3 | 160.9 | 167.1 | 164.2 | 158.3 | 157.8 | 145.5 | 148.7 | 146.0 | 150.9 |
| 2004 | 130.4 | 135.0 | 129.0 | 123.4 | 115.7 | 99.3 | 106.7 | 108.7 | 109.6 | 100.2 | 94.4 | 93.9 |
| 2005 | 88.2 | 92.1 | 88.1 | 79.1 | 79.9 | 79.9 | 75.3 | 69.0 | 57.4 | 57.0 | 55.5 | 59.5 |
| 2006 | 56.8 | 58.8 | 57.3 | W | W | 48.5 | W | W | W | W | W | W |
| 2007 | W | W | W | W | W | W | W | W | W | W | W | W |
| 2008 | W | W | 31.6 | 19.4 | 19.4 | 15.3 | 17.1 | 16.2 | 18.3 | 17.5 | NA | 6.0 |
| 2009 | 4.5 | W | 2.8 | W | W | W | W | W | W | W | W | W |
| 2010 | W | W | W | W | W | W | W | W | W | 2.7 | W | W |
| 2011 | W | W | W | W | W | W | W | W | W | W | W | W |
| 2012 | W | W | W | W | W | W | W | W | W | W | W | W |
| 2013 | 0.5 | 0.7 | 0.8 | 1.1 | W | W | W | W | W | W | W | W |
| 2014 | W | W | 2.2 | W | W | W | W | W | W | W | W | W |
| 2015 | W | W | W | W | W | W | W | W | W | W | W | W |
| 2016 | W | W | W | W | W | W | W | W | W | W | W | W |
| 2017 | W | W | W | W | W | W | W | W | W | W | W | W |
| 2018 | W | W | W | W | W | W | W | W | W | W | W | W |
| 2019 | W | W | W | W | W | W | W | W | W | W | W | W |
| 2020 | W | W | - | - | - | - | - | - | - | - | - | - |
| 2021 | - | - | - | - | W | W | W | W | W | W | W | W |
| 2022 | W | W | W | |||||||||
| - = No Data Reported; -- = Not Applicable; NA = Not Available; W = Withheld to avoid disclosure of individual company data. |
| Release Date: 6/1/2022 |
| Next Release Date: TBD |