|
Download Data (XLS File) |
|
||||||||
|
||||||||
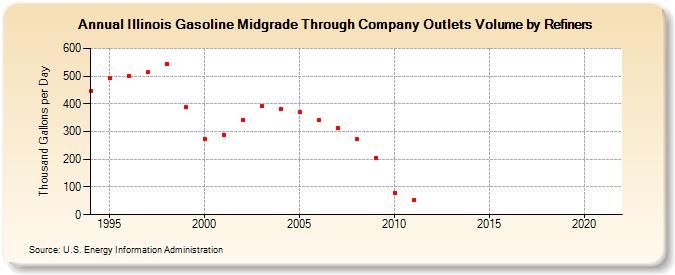
| Illinois Gasoline Midgrade Through Company Outlets Volume by Refiners (Thousand Gallons per Day) | ||||||||
| Decade | Year-0 | Year-1 | Year-2 | Year-3 | Year-4 | Year-5 | Year-6 | Year-7 | Year-8 | Year-9 |
|---|---|---|---|---|---|---|---|---|---|---|
| 1990's | 444.7 | 491.7 | 500.7 | 513.6 | 545.1 | 388.1 | ||||
| 2000's | 274.5 | 289.3 | 342.9 | 393.8 | 380.9 | 370.0 | 341.6 | 313.4 | 271.5 | 206.2 |
| 2010's | 79.9 | 54.7 | W | W | W | W | W | W | W | W |
| 2020's | W |
| - = No Data Reported; -- = Not Applicable; NA = Not Available; W = Withheld to avoid disclosure of individual company data. |
| Release Date: 6/1/2022 |
| Next Release Date: TBD |