|
Download Data (XLS File) |
|
||||||||
|
||||||||
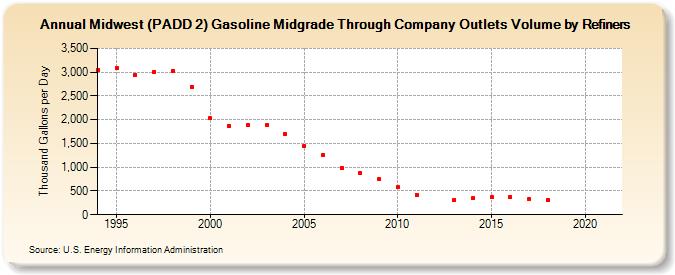
| Midwest (PADD 2) Gasoline Midgrade Through Company Outlets Volume by Refiners (Thousand Gallons per Day) | ||||||||
| Decade | Year-0 | Year-1 | Year-2 | Year-3 | Year-4 | Year-5 | Year-6 | Year-7 | Year-8 | Year-9 |
|---|---|---|---|---|---|---|---|---|---|---|
| 1990's | 3,054.4 | 3,088.5 | 2,940.1 | 3,010.6 | 3,030.1 | 2,695.3 | ||||
| 2000's | 2,026.4 | 1,874.9 | 1,883.2 | 1,888.9 | 1,692.2 | 1,446.2 | 1,262.1 | 988.9 | 874.8 | 747.5 |
| 2010's | 577.1 | 425.1 | W | 317.6 | 347.8 | 366.7 | 369.9 | 323.3 | 312.3 | W |
| 2020's | W |
| - = No Data Reported; -- = Not Applicable; NA = Not Available; W = Withheld to avoid disclosure of individual company data. |
| Release Date: 6/1/2022 |
| Next Release Date: TBD |