|
Download Data (XLS File) |
|
||||||||
|
||||||||
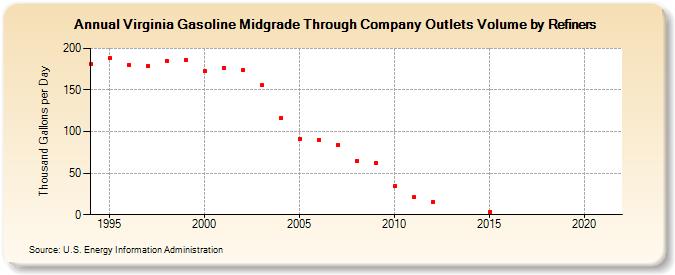
| Virginia Gasoline Midgrade Through Company Outlets Volume by Refiners (Thousand Gallons per Day) | ||||||||
| Decade | Year-0 | Year-1 | Year-2 | Year-3 | Year-4 | Year-5 | Year-6 | Year-7 | Year-8 | Year-9 |
|---|---|---|---|---|---|---|---|---|---|---|
| 1990's | 181.0 | 188.2 | 180.4 | 179.0 | 185.0 | 186.6 | ||||
| 2000's | 172.3 | 177.0 | 173.6 | 155.6 | 116.4 | 91.5 | 90.4 | 84.4 | 64.9 | 62.0 |
| 2010's | 34.5 | 20.7 | 15.3 | W | W | 3.6 | W | W | - | - |
| 2020's | - |
| - = No Data Reported; -- = Not Applicable; NA = Not Available; W = Withheld to avoid disclosure of individual company data. |
| Release Date: 6/1/2022 |
| Next Release Date: TBD |