|
Download Data (XLS File) |
|
||||||||
|
||||||||
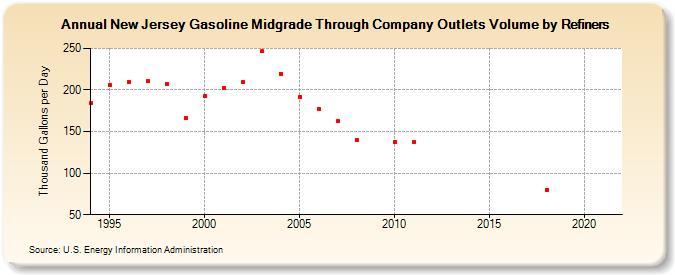
| New Jersey Gasoline Midgrade Through Company Outlets Volume by Refiners (Thousand Gallons per Day) | ||||||||
| Decade | Year-0 | Year-1 | Year-2 | Year-3 | Year-4 | Year-5 | Year-6 | Year-7 | Year-8 | Year-9 |
|---|---|---|---|---|---|---|---|---|---|---|
| 1990's | 184.1 | 205.7 | 209.7 | 210.6 | 206.6 | 166.1 | ||||
| 2000's | 192.2 | 201.9 | 209.7 | 246.7 | 219.7 | 192.0 | 176.8 | 162.1 | 140.3 | W |
| 2010's | 137.6 | 138.0 | W | W | W | W | W | W | 79.8 | W |
| 2020's | W |
| - = No Data Reported; -- = Not Applicable; NA = Not Available; W = Withheld to avoid disclosure of individual company data. |
| Release Date: 6/1/2022 |
| Next Release Date: TBD |