|
Download Data (XLS File) |
|
||||||||
|
||||||||
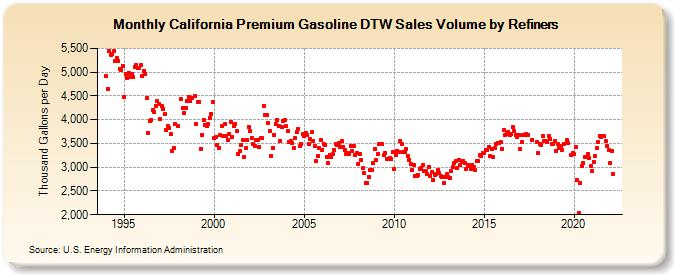
| California Premium Gasoline DTW Sales Volume by Refiners (Thousand Gallons per Day) | ||||||||
| Year | Jan | Feb | Mar | Apr | May | Jun | Jul | Aug | Sep | Oct | Nov | Dec |
|---|---|---|---|---|---|---|---|---|---|---|---|---|
| 1994 | 4,924.2 | 4,641.6 | 5,454.2 | 5,363.0 | 5,374.4 | 5,436.6 | 5,236.0 | 5,300.0 | 5,237.2 | 5,062.3 | 5,050.6 | 5,133.3 |
| 1995 | 4,476.8 | 4,956.8 | 4,872.4 | 4,989.6 | 4,890.4 | 4,969.5 | 4,888.1 | 5,111.0 | 5,149.9 | 5,086.8 | 5,094.2 | 5,143.2 |
| 1996 | 4,915.6 | 5,014.0 | 4,967.5 | 4,458.6 | 3,728.9 | 3,978.1 | 3,993.9 | 4,207.8 | 4,154.0 | 4,284.4 | 4,385.2 | 4,324.0 |
| 1997 | 4,004.2 | 4,281.2 | 4,215.5 | 4,129.4 | 3,791.5 | 3,872.5 | 3,823.9 | 3,690.1 | 3,349.7 | 3,410.3 | 3,906.8 | W |
| 1998 | 3,865.2 | W | 4,429.3 | 4,244.3 | 4,138.6 | 4,255.3 | 4,394.7 | 4,476.2 | 4,388.2 | 4,451.5 | W | 4,506.2 |
| 1999 | 3,900.8 | 4,368.8 | 4,372.5 | 3,388.4 | 3,682.7 | 3,984.0 | 3,896.5 | 3,862.5 | 3,907.3 | 4,043.1 | 4,119.6 | 4,381.9 |
| 2000 | 3,609.8 | 3,627.1 | 3,459.8 | 3,413.7 | 3,667.1 | 3,867.8 | 3,664.6 | 3,909.5 | 3,650.2 | 3,571.4 | 3,690.0 | 3,951.3 |
| 2001 | 3,631.8 | 3,867.0 | 3,916.8 | 3,755.8 | 3,284.4 | 3,334.5 | 3,475.3 | 3,579.5 | 3,223.7 | 3,399.6 | 3,567.7 | 3,853.6 |
| 2002 | 3,766.0 | 3,610.0 | 3,483.5 | 3,454.9 | 3,565.3 | 3,574.6 | 3,435.4 | 3,605.1 | 3,609.0 | 4,294.5 | 4,100.9 | 4,105.1 |
| 2003 | 3,940.4 | 3,766.5 | 3,236.0 | 3,401.5 | 3,686.7 | 3,909.8 | 3,998.8 | 3,857.6 | 3,549.0 | 3,845.0 | 3,971.9 | 3,993.4 |
| 2004 | 3,862.5 | 3,760.3 | 3,535.3 | 3,545.7 | 3,512.5 | 3,405.1 | 3,605.6 | 3,745.5 | 3,810.1 | 3,441.9 | 3,496.3 | 3,698.8 |
| 2005 | 3,653.7 | 3,714.7 | 3,682.7 | 3,478.2 | 3,588.5 | 3,735.5 | 3,560.6 | 3,441.2 | 3,139.7 | 3,228.1 | 3,406.1 | 3,569.4 |
| 2006 | 3,367.1 | 3,485.2 | 3,468.3 | 3,223.5 | 3,081.4 | 3,260.4 | 3,208.4 | 3,272.8 | 3,362.2 | 3,495.7 | 3,462.1 | 3,501.5 |
| 2007 | 3,419.3 | 3,549.9 | 3,429.1 | 3,351.3 | 3,268.2 | 3,299.8 | 3,277.3 | 3,438.7 | 3,335.7 | 3,443.7 | 3,256.0 | 3,298.3 |
| 2008 | 3,073.6 | 3,275.9 | 3,146.6 | 2,974.2 | 2,869.5 | 2,671.4 | 2,658.6 | 2,795.4 | 2,942.1 | 2,943.2 | 3,081.8 | 3,388.4 |
| 2009 | 3,157.2 | 3,275.0 | 3,478.4 | 3,486.8 | 3,484.5 | 3,257.9 | 3,306.1 | 3,174.7 | 3,170.0 | 3,201.0 | 3,164.3 | 3,320.6 |
| 2010 | 2,956.8 | 3,265.8 | 3,350.8 | 3,326.8 | 3,548.5 | 3,481.5 | 3,309.3 | 3,323.5 | 3,385.5 | 3,237.3 | 3,159.8 | 3,060.8 |
| 2011 | 2,950.2 | 3,039.0 | 2,806.0 | 2,814.5 | 2,837.3 | 2,952.4 | 2,990.7 | 3,036.5 | 2,911.2 | 2,912.9 | 2,848.8 | 3,009.6 |
| 2012 | 2,822.1 | 2,889.0 | 2,738.5 | 2,840.1 | 2,859.5 | 2,932.3 | 2,880.8 | 2,814.2 | 2,799.6 | 2,669.1 | 2,785.5 | 2,851.4 |
| 2013 | 2,797.3 | 2,780.3 | 2,926.2 | 3,005.9 | 3,083.7 | 3,122.1 | 2,982.8 | 3,151.9 | 3,040.1 | 3,105.6 | 3,140.2 | 3,093.6 |
| 2014 | 2,972.4 | 3,038.0 | 3,017.4 | 2,966.3 | 3,049.9 | 3,008.3 | 2,945.7 | 3,125.5 | 3,122.9 | 3,250.1 | 3,235.6 | 3,304.4 |
| 2015 | 3,307.3 | 3,371.0 | 3,354.3 | 3,426.9 | 3,230.1 | 3,378.1 | 3,214.3 | 3,397.4 | 3,489.4 | 3,517.5 | 3,498.8 | 3,528.7 |
| 2016 | 3,390.0 | 3,786.6 | 3,673.8 | 3,691.6 | 3,737.4 | 3,681.2 | 3,690.5 | 3,849.5 | 3,754.4 | 3,667.1 | 3,625.5 | 3,678.3 |
| 2017 | 3,388.9 | 3,523.1 | 3,680.4 | 3,681.0 | 3,692.8 | 3,679.7 | W | W | 3,577.7 | W | W | 3,527.9 |
| 2018 | 3,303.7 | 3,483.9 | 3,460.3 | 3,647.9 | 3,547.7 | 3,547.7 | 3,524.9 | 3,646.6 | 3,597.0 | 3,489.4 | 3,489.0 | 3,542.9 |
| 2019 | 3,347.9 | 3,489.5 | 3,405.5 | 3,440.4 | 3,355.8 | 3,487.3 | W | 3,571.5 | 3,503.6 | W | 3,262.8 | 3,299.5 |
| 2020 | 3,270.1 | 3,429.1 | 2,730.4 | 2,036.3 | 2,670.1 | 3,016.5 | 3,098.1 | 3,204.3 | 3,210.4 | 3,279.1 | 3,188.3 | 3,018.9 |
| 2021 | 2,909.5 | 3,119.7 | 3,228.3 | 3,401.3 | 3,533.7 | 3,661.6 | 3,640.6 | 3,647.3 | 3,648.6 | 3,542.2 | 3,455.5 | 3,352.5 |
| 2022 | 3,091.2 | 3,335.8 | 2,849.8 | |||||||||
| - = No Data Reported; -- = Not Applicable; NA = Not Available; W = Withheld to avoid disclosure of individual company data. |
| Release Date: 6/1/2022 |
| Next Release Date: TBD |