|
Download Data (XLS File) |
|
||||||||
|
||||||||
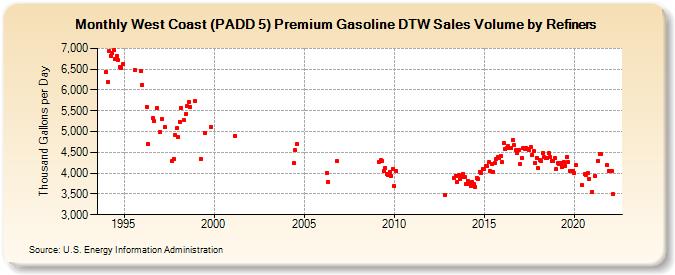
| West Coast (PADD 5) Premium Gasoline DTW Sales Volume by Refiners (Thousand Gallons per Day) | ||||||||
| Year | Jan | Feb | Mar | Apr | May | Jun | Jul | Aug | Sep | Oct | Nov | Dec |
|---|---|---|---|---|---|---|---|---|---|---|---|---|
| 1994 | 6,431.6 | 6,198.0 | 6,930.0 | 6,827.4 | 6,879.2 | 6,953.2 | 6,749.9 | 6,824.8 | 6,718.9 | 6,550.4 | 6,533.8 | 6,617.4 |
| 1995 | W | W | W | W | W | W | W | 6,491.5 | W | W | W | 6,445.0 |
| 1996 | 6,120.0 | W | W | 5,598.9 | 4,704.4 | W | W | 5,317.6 | 5,242.3 | W | 5,565.0 | W |
| 1997 | 4,998.0 | 5,307.7 | W | 5,113.7 | W | W | W | W | 4,297.2 | 4,333.0 | 4,921.0 | 5,076.1 |
| 1998 | 4,861.8 | 5,238.2 | 5,571.2 | W | 5,267.5 | 5,420.1 | 5,604.5 | 5,700.1 | 5,593.2 | W | W | 5,729.4 |
| 1999 | W | W | W | 4,346.8 | W | W | 4,971.2 | W | W | W | 5,120.4 | W |
| 2000 | W | W | W | W | W | W | W | W | W | W | W | W |
| 2001 | W | W | 4,901.5 | W | W | W | W | W | W | W | W | W |
| 2002 | W | W | W | W | W | W | W | W | W | W | W | W |
| 2003 | W | W | W | W | W | W | W | W | W | W | W | W |
| 2004 | W | W | W | W | W | 4,241.7 | 4,546.0 | 4,694.8 | W | W | W | W |
| 2005 | W | W | W | W | W | W | W | W | W | W | W | W |
| 2006 | W | W | W | 3,997.7 | 3,794.7 | W | W | W | W | W | 4,287.7 | W |
| 2007 | W | W | W | W | W | W | W | W | W | W | W | W |
| 2008 | W | W | W | W | W | W | W | W | W | W | W | W |
| 2009 | W | W | 4,268.5 | 4,314.0 | 4,292.0 | 4,045.7 | 4,130.1 | 3,987.7 | 3,961.9 | 4,027.0 | 3,942.6 | 4,109.5 |
| 2010 | 3,687.3 | 4,052.3 | W | W | W | W | W | W | W | W | W | W |
| 2011 | W | W | W | W | W | W | W | W | W | W | W | W |
| 2012 | W | W | W | W | W | W | W | W | W | W | 3,481.5 | W |
| 2013 | W | W | W | W | 3,879.5 | 3,939.3 | 3,778.7 | 3,956.8 | 3,860.1 | 3,905.9 | 3,986.2 | 3,896.3 |
| 2014 | 3,733.8 | 3,819.0 | 3,737.5 | 3,694.3 | 3,782.6 | 3,729.2 | 3,677.7 | 3,886.6 | 3,866.4 | 4,020.7 | 4,005.9 | 4,088.0 |
| 2015 | 4,093.4 | 4,178.6 | 4,166.8 | 4,257.4 | 4,046.9 | 4,210.8 | 4,039.2 | 4,232.0 | 4,340.3 | 4,386.5 | 4,364.6 | 4,410.4 |
| 2016 | 4,257.7 | 4,713.3 | 4,588.3 | 4,606.6 | 4,649.0 | 4,602.8 | 4,606.2 | 4,794.4 | 4,666.8 | 4,553.4 | 4,495.0 | 4,560.0 |
| 2017 | 4,209.1 | 4,375.5 | 4,594.5 | 4,592.4 | 4,607.1 | 4,586.7 | 4,565.8 | 4,625.1 | 4,445.0 | 4,522.3 | 4,254.1 | 4,371.3 |
| 2018 | 4,111.6 | 4,306.0 | 4,302.3 | 4,483.0 | 4,382.1 | 4,357.1 | 4,353.7 | 4,474.7 | 4,383.1 | 4,293.7 | 4,296.2 | 4,362.4 |
| 2019 | 4,088.2 | 4,232.3 | 4,216.3 | 4,248.4 | 4,141.2 | 4,269.9 | 4,177.7 | 4,390.5 | 4,278.3 | 4,063.0 | W | 4,055.7 |
| 2020 | 4,003.9 | 4,188.5 | W | W | W | 3,712.1 | W | 3,969.0 | 3,960.4 | 4,000.7 | 3,866.1 | W |
| 2021 | 3,548.3 | W | 3,930.9 | W | 4,301.5 | 4,469.8 | 4,450.4 | W | W | W | 4,184.4 | 4,061.0 |
| 2022 | W | 4,051.1 | 3,493.3 | |||||||||
| - = No Data Reported; -- = Not Applicable; NA = Not Available; W = Withheld to avoid disclosure of individual company data. |
| Release Date: 6/1/2022 |
| Next Release Date: TBD |