|
Download Data (XLS File) |
|
||||||||
|
||||||||
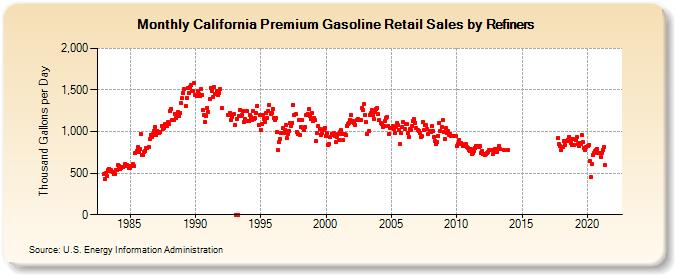
| California Premium Gasoline Retail Sales by Refiners (Thousand Gallons per Day) | ||||||||
| Year | Jan | Feb | Mar | Apr | May | Jun | Jul | Aug | Sep | Oct | Nov | Dec |
|---|---|---|---|---|---|---|---|---|---|---|---|---|
| 1983 | 489.0 | 424.8 | 500.5 | 470.1 | 534.1 | 553.5 | 528.7 | 533.7 | 508.6 | 492.1 | 487.0 | 542.3 |
| 1984 | 540.5 | 598.2 | 582.9 | 552.8 | 565.3 | 574.9 | 572.9 | 608.5 | 580.0 | 594.3 | 583.9 | 563.6 |
| 1985 | 556.9 | 581.9 | 591.5 | 606.0 | 585.7 | 745.4 | 761.5 | 812.4 | 751.2 | 793.4 | 967.7 | 718.2 |
| 1986 | 713.5 | 758.5 | 763.6 | 807.0 | 797.5 | 819.8 | 907.0 | 964.1 | 931.7 | 976.5 | 1,011.7 | 1,054.7 |
| 1987 | 960.2 | 1,004.8 | 998.5 | 983.1 | 992.4 | 1,071.2 | 1,028.8 | 1,041.9 | 1,088.3 | 1,065.2 | 1,070.0 | 1,116.0 |
| 1988 | 1,089.1 | 1,242.4 | 1,272.8 | 1,137.0 | 1,139.4 | 1,208.9 | 1,162.8 | 1,190.1 | 1,234.5 | 1,181.5 | 1,224.9 | 1,337.8 |
| 1989 | 1,397.6 | 1,466.3 | 1,506.4 | 1,304.5 | 1,402.6 | 1,523.0 | 1,464.2 | 1,537.5 | 1,562.5 | 1,484.4 | 1,483.7 | 1,580.3 |
| 1990 | 1,434.8 | 1,428.8 | 1,491.4 | 1,456.5 | 1,427.6 | 1,513.9 | 1,440.6 | 1,253.3 | 1,199.3 | 1,119.2 | 1,188.2 | 1,289.0 |
| 1991 | 1,239.6 | 1,387.8 | 1,527.7 | 1,492.6 | 1,415.2 | 1,537.0 | 1,454.7 | 1,455.1 | 1,490.8 | 1,435.3 | 1,462.6 | 1,509.3 |
| 1992 | 1,282.5 | W | W | W | W | W | 1,204.6 | 1,199.4 | 1,226.8 | 1,141.4 | 1,175.3 | 1,205.7 |
| 1993 | 1,073.7 | 0.0 | 1,155.6 | 0.0 | 1,191.2 | 1,261.9 | 1,187.1 | 1,200.2 | 1,244.7 | 1,118.6 | 1,145.2 | 1,248.3 |
| 1994 | 1,128.6 | 1,125.8 | 1,197.9 | 1,170.1 | 1,142.6 | 1,249.0 | 1,150.2 | 1,157.6 | 1,219.9 | 1,310.1 | 1,076.5 | 1,195.7 |
| 1995 | 1,023.7 | 1,096.3 | 1,199.0 | 1,155.9 | 1,117.6 | 1,222.8 | 1,164.9 | 1,244.4 | 1,320.3 | 1,212.2 | 1,226.3 | 1,274.6 |
| 1996 | 1,162.6 | 1,136.4 | 1,163.3 | 989.1 | 776.9 | 869.4 | 912.5 | 979.7 | 1,044.4 | 986.1 | 1,023.2 | 1,077.3 |
| 1997 | 917.2 | 975.2 | 1,010.5 | 1,103.9 | 1,072.2 | 1,104.2 | 1,318.7 | 1,196.0 | 1,208.9 | 999.9 | 971.9 | 1,138.3 |
| 1998 | 963.9 | 1,053.8 | 1,134.2 | 1,038.4 | 1,020.6 | 1,053.9 | 1,194.1 | 1,216.4 | 1,270.9 | 1,183.9 | 1,153.9 | 1,226.6 |
| 1999 | 1,131.3 | 1,160.4 | 1,141.3 | 886.7 | 984.0 | 1,064.4 | 1,035.0 | 963.0 | 987.3 | 1,023.5 | 1,030.3 | 1,041.9 |
| 2000 | 941.0 | 981.3 | 842.1 | 856.1 | 930.5 | 971.7 | 958.9 | 979.5 | 948.0 | 875.0 | 928.8 | 974.2 |
| 2001 | 904.4 | 996.1 | 1,014.4 | 974.8 | 894.6 | 974.5 | 956.8 | 1,062.2 | 1,095.0 | 1,101.5 | 1,143.5 | 1,200.9 |
| 2002 | 1,110.7 | 1,125.2 | 1,106.0 | 1,080.0 | 1,134.0 | 1,156.4 | 1,142.1 | 1,141.8 | 1,140.8 | 1,277.2 | 1,257.7 | 1,326.6 |
| 2003 | 1,193.1 | 1,114.6 | 975.2 | 1,003.1 | 1,203.1 | 1,222.2 | 1,262.1 | 1,194.2 | 1,147.4 | 1,240.9 | 1,276.6 | 1,281.4 |
| 2004 | 1,209.4 | 1,135.9 | 1,098.4 | 1,096.5 | 1,050.5 | 1,065.0 | 1,123.0 | 1,166.7 | 1,172.8 | 1,068.2 | 976.2 | 1,039.5 |
| 2005 | 1,045.6 | 1,062.9 | 1,030.1 | 988.6 | 1,051.5 | 1,102.1 | 1,076.9 | 1,015.5 | 855.1 | 978.8 | 1,057.7 | 1,109.4 |
| 2006 | 1,025.4 | 1,088.8 | 1,087.7 | 987.3 | 934.5 | 1,025.7 | 1,013.4 | 1,068.1 | 1,131.3 | 1,146.2 | 1,107.7 | 1,039.5 |
| 2007 | 1,022.0 | 1,011.5 | 978.4 | 935.8 | 942.6 | 1,115.4 | 1,019.1 | 1,081.7 | 1,073.7 | 1,033.1 | 970.8 | 1,003.3 |
| 2008 | 990.9 | 1,061.0 | 1,003.1 | 936.7 | 881.4 | 846.9 | 869.1 | 948.4 | 1,107.6 | 1,010.6 | 1,058.9 | 1,140.8 |
| 2009 | 1,000.0 | 911.5 | 1,041.9 | 982.6 | 1,011.4 | 964.2 | 974.9 | 951.9 | 952.2 | 951.8 | 942.8 | 948.3 |
| 2010 | 822.7 | 856.1 | 903.4 | 859.0 | 865.2 | 849.2 | 823.6 | 831.8 | 849.2 | 813.4 | 805.8 | 779.7 |
| 2011 | 766.3 | 786.1 | 731.1 | 744.3 | 766.5 | 801.4 | 822.4 | 825.6 | 816.9 | 825.0 | 742.9 | 768.1 |
| 2012 | 724.2 | 732.3 | 712.9 | 735.1 | 737.9 | 760.0 | 780.1 | 772.6 | 773.5 | 727.3 | 779.6 | 794.2 |
| 2013 | 759.6 | 757.5 | 794.6 | 825.9 | 787.0 | W | W | 778.1 | W | W | W | 784.1 |
| 2014 | W | W | W | W | W | W | W | W | W | W | W | W |
| 2015 | W | W | W | W | W | W | W | W | W | W | W | W |
| 2016 | W | W | W | W | W | W | W | W | W | W | W | W |
| 2017 | W | W | W | W | W | W | W | W | W | 922.7 | 847.2 | 830.2 |
| 2018 | 778.8 | 812.6 | 882.0 | 843.6 | 883.9 | 891.5 | 899.8 | 934.8 | 912.7 | 865.1 | 843.1 | 904.8 |
| 2019 | 840.5 | 895.5 | 932.9 | 846.5 | 822.3 | 866.4 | 852.6 | 958.1 | 870.4 | 800.5 | 783.2 | 819.2 |
| 2020 | 828.1 | 832.5 | 644.6 | 449.1 | 604.9 | 712.2 | 739.0 | 760.6 | 774.3 | 790.9 | 748.1 | 736.3 |
| 2021 | 698.3 | 748.1 | 779.4 | 812.3 | 595.0 | W | W | W | W | W | W | W |
| 2022 | W | W | W | |||||||||
| - = No Data Reported; -- = Not Applicable; NA = Not Available; W = Withheld to avoid disclosure of individual company data. |
| Release Date: 6/1/2022 |
| Next Release Date: TBD |