|
Download Data (XLS File) |
|
||||||||
|
||||||||
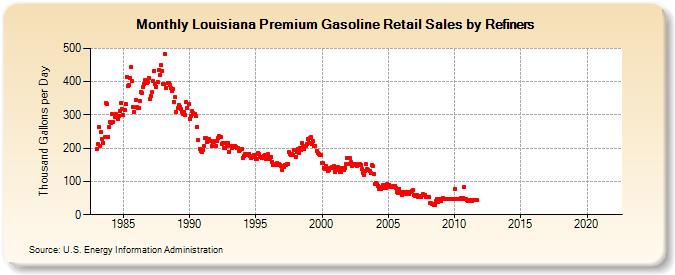
| Louisiana Premium Gasoline Retail Sales by Refiners (Thousand Gallons per Day) | ||||||||
| Year | Jan | Feb | Mar | Apr | May | Jun | Jul | Aug | Sep | Oct | Nov | Dec |
|---|---|---|---|---|---|---|---|---|---|---|---|---|
| 1983 | 196.3 | 211.5 | 263.3 | 206.8 | 247.9 | 227.9 | 216.9 | 233.2 | 334.6 | 331.5 | 234.3 | 262.5 |
| 1984 | 279.7 | 276.5 | 303.8 | 278.8 | 292.6 | 302.7 | 296.5 | 288.4 | 296.9 | 311.2 | 335.1 | 317.3 |
| 1985 | 299.5 | 314.7 | 332.0 | 414.9 | 387.8 | 391.0 | 410.4 | 444.8 | 401.8 | 323.2 | 310.2 | 346.3 |
| 1986 | 323.9 | 319.3 | 320.8 | 341.0 | 369.2 | 364.5 | 382.7 | 393.0 | 405.6 | 396.7 | 399.9 | 409.7 |
| 1987 | 346.5 | 357.1 | 368.1 | 401.7 | 432.4 | 391.9 | 385.1 | 398.3 | 435.3 | 421.3 | 450.8 | 433.2 |
| 1988 | 391.9 | 392.4 | 483.2 | 380.9 | 396.9 | 397.3 | 391.0 | 380.6 | 372.0 | 377.2 | 339.6 | 352.5 |
| 1989 | 308.2 | 319.9 | 330.9 | 324.5 | 317.6 | 310.1 | 302.1 | 308.3 | 299.4 | 338.0 | 321.9 | 334.1 |
| 1990 | 287.9 | 295.6 | 310.9 | 306.2 | W | 303.7 | 295.7 | 263.7 | 223.7 | 197.6 | 191.3 | 189.0 |
| 1991 | 194.3 | 207.5 | 229.3 | 230.3 | 219.0 | 222.5 | 226.2 | 222.0 | 206.3 | 219.8 | 219.0 | 223.0 |
| 1992 | 207.7 | 223.0 | 229.5 | 235.8 | 233.0 | 213.8 | 216.3 | 200.9 | 200.0 | 215.7 | 206.7 | 215.2 |
| 1993 | 189.9 | 206.8 | 200.0 | 202.9 | 206.5 | 207.0 | 204.7 | 200.4 | 199.5 | 192.2 | 194.0 | 196.4 |
| 1994 | 171.4 | 177.4 | 182.4 | 179.8 | 182.3 | 182.3 | 183.3 | 176.0 | 169.7 | 172.6 | 179.4 | 179.4 |
| 1995 | 166.7 | 167.3 | 185.9 | 181.4 | 175.0 | 172.3 | 170.0 | 176.6 | 179.4 | 168.2 | 178.5 | 182.2 |
| 1996 | 167.9 | 171.6 | 172.8 | 159.4 | 149.5 | 148.6 | 152.3 | 154.2 | 148.2 | 153.1 | 148.6 | 147.5 |
| 1997 | 134.6 | 142.4 | 149.2 | 150.6 | 152.3 | 153.6 | 188.5 | 181.6 | 179.5 | 181.7 | 180.0 | 193.7 |
| 1998 | 174.3 | 189.1 | 197.0 | 184.1 | 200.6 | 193.4 | 215.2 | 202.1 | 196.3 | 206.7 | 211.7 | 228.5 |
| 1999 | 215.7 | 230.4 | 232.3 | 213.4 | 220.2 | 207.7 | 207.6 | 191.7 | 186.0 | 182.6 | 180.3 | 180.1 |
| 2000 | 156.5 | 155.0 | 141.2 | 136.9 | 146.2 | 131.9 | 135.5 | 139.0 | 140.4 | 143.1 | 141.6 | 145.3 |
| 2001 | 129.2 | 139.3 | 144.6 | 133.7 | 129.2 | 129.6 | 141.3 | 140.0 | 135.1 | 140.3 | 151.2 | 169.7 |
| 2002 | 152.7 | 169.4 | 157.6 | 146.1 | 153.6 | 151.9 | 148.8 | 153.7 | 147.5 | 149.3 | 152.6 | 150.8 |
| 2003 | 137.0 | 125.1 | 120.6 | 131.5 | 151.3 | 136.8 | 135.0 | 130.1 | 124.8 | 149.1 | 146.4 | 121.3 |
| 2004 | 91.2 | 96.4 | 92.5 | 87.8 | 76.4 | 77.0 | 84.2 | 87.9 | 90.0 | 79.8 | 80.4 | 91.7 |
| 2005 | 86.0 | 90.1 | 84.8 | 83.3 | 86.4 | 85.3 | 85.4 | 79.4 | 67.3 | 64.3 | 78.0 | 67.1 |
| 2006 | 60.5 | 68.5 | 69.2 | 65.4 | 63.5 | 69.0 | 63.4 | 61.4 | 67.8 | 71.9 | 73.0 | 60.6 |
| 2007 | 57.4 | W | 60.1 | 54.6 | 53.1 | 57.0 | 54.1 | 60.9 | 58.8 | 59.6 | 53.4 | 54.3 |
| 2008 | 51.9 | 52.6 | 34.6 | 33.9 | 32.5 | 29.9 | 29.7 | 40.0 | 46.2 | 39.7 | 43.5 | 45.9 |
| 2009 | 40.6 | 48.4 | 49.3 | 48.7 | 48.1 | 46.2 | 47.3 | 46.9 | 47.6 | 46.8 | 45.9 | 46.1 |
| 2010 | 76.4 | 46.1 | 46.5 | 46.4 | 48.5 | 48.3 | 49.9 | 48.2 | 49.8 | 82.8 | 47.7 | 45.0 |
| 2011 | 41.9 | 44.5 | 42.9 | 43.1 | 41.9 | 43.6 | 42.8 | 44.5 | 45.5 | W | W | W |
| 2012 | W | W | W | W | W | W | W | W | W | W | W | W |
| 2013 | W | W | W | W | - | W | - | W | - | - | - | - |
| 2014 | - | - | - | - | - | - | - | - | - | - | - | - |
| 2015 | - | - | - | - | - | - | - | - | - | - | - | - |
| 2016 | - | - | W | W | W | - | - | - | - | - | - | - |
| 2017 | - | - | - | - | - | - | - | - | - | - | - | - |
| 2018 | - | - | - | - | - | - | - | - | - | - | - | - |
| 2019 | - | - | - | - | - | - | - | - | - | - | - | - |
| 2020 | - | - | - | - | - | - | - | - | - | - | - | W |
| 2021 | - | - | W | - | - | - | - | - | - | - | - | - |
| 2022 | - | - | - | |||||||||
| - = No Data Reported; -- = Not Applicable; NA = Not Available; W = Withheld to avoid disclosure of individual company data. |
| Release Date: 6/1/2022 |
| Next Release Date: TBD |