|
Download Data (XLS File) |
|
||||||||
|
||||||||
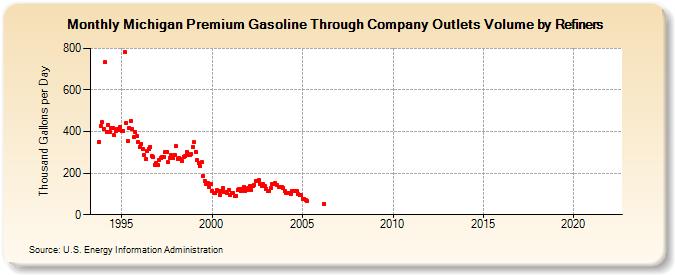
| Michigan Premium Gasoline Through Company Outlets Volume by Refiners (Thousand Gallons per Day) | ||||||||
| Year | Jan | Feb | Mar | Apr | May | Jun | Jul | Aug | Sep | Oct | Nov | Dec |
|---|---|---|---|---|---|---|---|---|---|---|---|---|
| 1993 | 349.6 | 427.2 | 444.6 | |||||||||
| 1994 | 414.2 | 732.7 | 398.7 | 432.2 | 399.1 | 417.6 | 418.0 | 382.2 | 400.4 | 412.3 | 408.0 | 423.4 |
| 1995 | 401.1 | 404.4 | 782.2 | 440.9 | 356.9 | 418.9 | 451.1 | 411.2 | 372.6 | 397.2 | 377.0 | 348.3 |
| 1996 | 327.3 | 342.2 | 317.0 | 286.1 | 265.8 | 304.1 | 318.2 | 327.5 | 283.4 | 276.9 | 238.4 | 248.0 |
| 1997 | 238.1 | 260.8 | 272.0 | 279.7 | 275.8 | 302.1 | 301.8 | 252.0 | 273.6 | 285.6 | 273.8 | 288.2 |
| 1998 | 328.6 | 269.8 | 272.4 | 268.2 | 260.7 | 279.9 | 280.6 | 303.4 | 285.1 | 288.4 | 292.6 | 327.5 |
| 1999 | 348.1 | 303.3 | 261.8 | 247.8 | 232.7 | 252.1 | 185.4 | 163.4 | 148.7 | 152.1 | 131.7 | 145.9 |
| 2000 | 115.8 | 105.2 | 104.2 | 117.9 | 112.6 | 94.9 | 115.5 | 126.8 | 111.5 | 110.5 | 103.1 | 120.4 |
| 2001 | 92.5 | 105.1 | 105.3 | 89.0 | 90.2 | 120.1 | 124.1 | 116.3 | 124.6 | 134.9 | 114.8 | 117.1 |
| 2002 | 129.2 | 135.9 | 120.2 | 138.1 | 144.3 | 164.3 | 161.0 | 166.8 | 148.9 | 137.0 | 146.1 | 136.8 |
| 2003 | 125.1 | 112.6 | 113.6 | 128.7 | 146.1 | 149.9 | 153.0 | 141.8 | 133.9 | 135.5 | 131.3 | 128.4 |
| 2004 | 113.4 | 106.6 | 106.0 | 105.7 | 98.8 | 115.6 | 115.8 | 116.1 | 114.2 | 99.1 | 93.0 | 92.9 |
| 2005 | 77.6 | 76.3 | 68.8 | 64.8 | W | W | W | W | W | W | W | W |
| 2006 | W | W | 52.5 | W | W | W | W | W | W | W | W | W |
| 2007 | W | W | W | W | W | W | W | W | W | W | W | W |
| 2008 | W | W | W | W | W | W | W | W | W | W | W | W |
| 2009 | W | W | W | W | W | W | W | W | W | W | W | W |
| 2010 | W | W | W | W | W | W | W | W | W | W | W | W |
| 2011 | W | W | W | W | W | W | W | W | W | W | W | W |
| 2012 | W | W | W | W | W | NA | W | W | W | W | W | W |
| 2013 | W | W | W | W | W | W | W | W | W | W | W | W |
| 2014 | W | W | W | W | W | W | W | W | W | W | W | W |
| 2015 | W | W | W | W | W | W | W | W | W | W | W | W |
| 2016 | W | W | W | W | W | W | W | W | W | W | W | W |
| 2017 | W | W | W | W | W | W | W | W | W | W | W | W |
| 2018 | W | W | W | W | W | W | W | W | W | W | W | W |
| 2019 | W | W | W | W | W | W | W | W | W | W | W | W |
| 2020 | W | W | W | W | W | W | W | W | W | W | W | W |
| 2021 | W | W | W | W | W | - | - | - | - | - | - | - |
| 2022 | - | - | - | |||||||||
| - = No Data Reported; -- = Not Applicable; NA = Not Available; W = Withheld to avoid disclosure of individual company data. |
| Release Date: 6/1/2022 |
| Next Release Date: TBD |