|
Download Data (XLS File) |
|
||||||||
|
||||||||
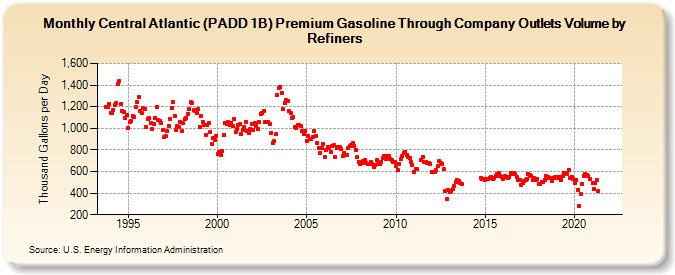
| Central Atlantic (PADD 1B) Premium Gasoline Through Company Outlets Volume by Refiners (Thousand Gallons per Day) | ||||||||
| Year | Jan | Feb | Mar | Apr | May | Jun | Jul | Aug | Sep | Oct | Nov | Dec |
|---|---|---|---|---|---|---|---|---|---|---|---|---|
| 1993 | 1,196.0 | 1,200.9 | 1,228.9 | |||||||||
| 1994 | 1,145.5 | 1,137.8 | 1,167.6 | 1,218.3 | 1,231.1 | 1,410.8 | 1,438.5 | 1,224.9 | 1,156.4 | 1,149.7 | 1,099.9 | 1,123.6 |
| 1995 | 1,006.0 | 1,059.3 | 1,069.0 | 1,111.4 | 1,102.1 | 1,195.9 | 1,239.0 | 1,287.3 | 1,164.3 | 1,142.6 | 1,185.4 | 1,177.4 |
| 1996 | 1,008.3 | 1,090.4 | 1,092.7 | 1,045.3 | 989.6 | 1,044.2 | 1,099.1 | 1,198.8 | 1,072.7 | 1,071.7 | 1,051.5 | 981.1 |
| 1997 | 921.4 | 927.1 | 975.1 | 1,021.7 | 1,087.8 | 1,191.4 | 1,242.0 | 1,117.0 | 988.3 | 1,020.7 | 1,014.2 | 1,053.9 |
| 1998 | 977.8 | 1,045.8 | 1,087.3 | 1,095.1 | 1,133.8 | 1,178.3 | 1,239.6 | 1,233.4 | 1,164.9 | 1,156.2 | 1,143.0 | 1,178.4 |
| 1999 | 1,015.9 | 1,117.9 | 1,055.3 | 1,031.4 | 933.9 | 1,031.5 | 1,049.6 | 963.0 | 859.1 | 906.0 | 896.2 | 927.4 |
| 2000 | 760.0 | 785.0 | 751.7 | 788.8 | 935.9 | 1,048.2 | 1,039.6 | 1,061.7 | 1,026.5 | 1,051.5 | 1,025.5 | 1,084.9 |
| 2001 | 962.2 | 993.6 | 1,026.8 | 1,035.7 | 943.5 | 982.3 | 1,016.3 | 1,059.7 | 978.9 | 952.5 | 989.7 | 1,038.8 |
| 2002 | 983.5 | 1,048.7 | 1,020.8 | 995.2 | 1,060.5 | 1,128.0 | 1,143.2 | 1,160.0 | 1,059.7 | 1,058.4 | 1,061.4 | 1,041.7 |
| 2003 | 957.4 | 866.3 | 886.2 | 942.8 | 1,308.8 | 1,369.7 | 1,385.8 | 1,327.3 | 1,177.7 | 1,235.1 | 1,259.7 | 1,253.6 |
| 2004 | 1,157.2 | 1,144.4 | 1,099.8 | 1,100.0 | 1,010.0 | 1,002.0 | 1,027.4 | 1,026.6 | 1,023.5 | 977.2 | 944.3 | 977.2 |
| 2005 | 885.9 | 929.8 | 901.9 | 898.6 | 918.1 | 971.0 | 929.7 | 866.4 | 817.5 | 775.1 | 815.6 | 852.4 |
| 2006 | 736.9 | 797.2 | 829.6 | 813.9 | 783.2 | 836.1 | 843.6 | 736.5 | 814.3 | 830.4 | 822.5 | 808.1 |
| 2007 | 747.0 | 767.7 | 751.2 | 756.4 | 820.5 | 838.1 | 847.9 | 860.3 | 834.2 | 800.3 | 735.5 | 692.6 |
| 2008 | 668.6 | 681.6 | 694.8 | 706.6 | 679.2 | 673.8 | 667.6 | 688.9 | 673.3 | 642.0 | 662.4 | 703.8 |
| 2009 | 672.9 | 673.2 | 688.7 | 728.1 | 739.2 | 720.2 | 742.6 | 742.0 | 715.4 | 702.8 | 684.2 | 687.0 |
| 2010 | 651.7 | 612.0 | 672.2 | 712.4 | 740.5 | 770.9 | 780.6 | 754.1 | 731.4 | 722.2 | 691.3 | 664.6 |
| 2011 | 593.3 | 619.2 | 623.0 | W | W | 703.1 | 735.8 | 687.2 | 687.5 | 682.5 | 680.9 | 668.0 |
| 2012 | 594.3 | 598.7 | 599.0 | 613.5 | 653.2 | 693.2 | 680.1 | 670.7 | 618.7 | 420.7 | 341.5 | 426.8 |
| 2013 | 414.6 | 420.4 | 438.0 | 463.9 | 498.8 | 521.7 | 508.8 | 495.3 | 484.1 | NA | NA | W |
| 2014 | W | W | W | W | W | W | W | W | W | 543.5 | 533.6 | 531.0 |
| 2015 | 523.0 | 534.4 | 528.8 | 544.3 | 551.3 | 528.3 | 539.9 | 561.3 | 575.2 | 584.7 | 556.5 | 549.2 |
| 2016 | 529.7 | 554.5 | 551.7 | 543.0 | 552.9 | 583.3 | 577.6 | 588.5 | 577.5 | 546.6 | 519.4 | 522.8 |
| 2017 | 479.6 | 490.0 | 508.3 | 521.4 | 530.8 | 572.8 | 565.2 | 553.9 | 525.8 | 536.5 | 517.5 | 528.4 |
| 2018 | 483.3 | 487.1 | 507.2 | 505.2 | 519.4 | 555.4 | 547.5 | 544.5 | 536.3 | 515.9 | 541.1 | 550.6 |
| 2019 | 545.9 | 543.5 | 549.0 | 525.9 | 558.1 | 587.5 | 586.3 | 580.4 | 613.0 | 541.4 | 547.7 | 530.5 |
| 2020 | 495.5 | 522.2 | 431.4 | 283.4 | 389.3 | 486.2 | 561.5 | 573.5 | 564.7 | 560.2 | 530.4 | NA |
| 2021 | 490.1 | 442.5 | 497.0 | 521.2 | 417.3 | W | W | W | W | W | W | W |
| 2022 | W | W | W | |||||||||
| - = No Data Reported; -- = Not Applicable; NA = Not Available; W = Withheld to avoid disclosure of individual company data. |
| Release Date: 6/1/2022 |
| Next Release Date: TBD |