|
Download Data (XLS File) |
|
||||||||
|
||||||||
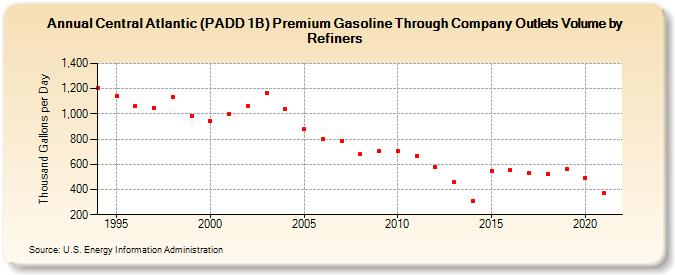
| Central Atlantic (PADD 1B) Premium Gasoline Through Company Outlets Volume by Refiners (Thousand Gallons per Day) | ||||||||
| Decade | Year-0 | Year-1 | Year-2 | Year-3 | Year-4 | Year-5 | Year-6 | Year-7 | Year-8 | Year-9 |
|---|---|---|---|---|---|---|---|---|---|---|
| 1990's | 1,209.1 | 1,145.5 | 1,062.1 | 1,047.6 | 1,136.8 | 981.4 | ||||
| 2000's | 947.2 | 998.4 | 1,063.6 | 1,166.4 | 1,040.5 | 879.8 | 804.2 | 787.8 | 678.5 | 708.3 |
| 2010's | 709.3 | 663.7 | 575.8 | 456.6 | 311.0 | 548.1 | 553.9 | 527.7 | 524.7 | 559.1 |
| 2020's | 491.4 |
| - = No Data Reported; -- = Not Applicable; NA = Not Available; W = Withheld to avoid disclosure of individual company data. |
| Release Date: 6/1/2022 |
| Next Release Date: TBD |