|
Download Data (XLS File) |
|
||||||||
|
||||||||
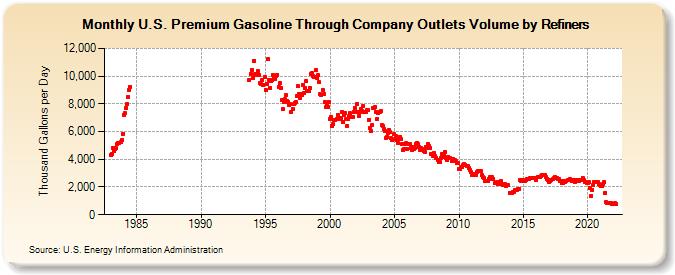
| U.S. Premium Gasoline Through Company Outlets Volume by Refiners (Thousand Gallons per Day) | ||||||||
| Year | Jan | Feb | Mar | Apr | May | Jun | Jul | Aug | Sep | Oct | Nov | Dec |
|---|---|---|---|---|---|---|---|---|---|---|---|---|
| 1983 | 4,328.5 | 4,396.3 | 4,842.6 | 4,606.4 | 4,769.4 | 4,786.4 | 5,091.8 | 5,208.3 | 5,206.8 | 5,238.5 | 5,370.0 | 5,858.0 |
| 1984 | 7,224.4 | 7,314.9 | 7,734.6 | 7,980.6 | 8,519.5 | 9,016.6 | 9,249.6 | |||||
| 1993 | 9,721.2 | 10,160.6 | 10,466.9 | |||||||||
| 1994 | 9,886.7 | 11,117.6 | 10,121.8 | 10,090.9 | 10,074.2 | 10,367.4 | 10,078.1 | 9,514.2 | 9,438.3 | 9,741.4 | 9,385.5 | 9,899.9 |
| 1995 | 9,032.5 | 9,459.4 | 11,218.6 | 9,745.3 | 9,176.5 | 9,638.9 | 9,745.3 | 10,070.8 | 9,853.7 | 9,806.0 | 10,035.3 | 10,044.9 |
| 1996 | 9,221.9 | 9,475.6 | 9,111.1 | 8,259.4 | 7,621.2 | 8,108.6 | 8,337.5 | 8,627.8 | 8,224.0 | 8,154.3 | 7,888.4 | 7,961.0 |
| 1997 | 7,400.7 | 7,661.6 | 7,999.8 | 8,063.3 | 8,138.0 | 8,573.8 | 9,284.3 | 8,730.8 | 8,439.6 | 8,721.2 | 8,646.5 | 9,382.6 |
| 1998 | 8,792.8 | 9,158.5 | 9,650.4 | 8,892.0 | 8,935.7 | 9,162.0 | 10,143.5 | 10,242.3 | 10,008.4 | 9,968.9 | 9,928.4 | 10,424.8 |
| 1999 | 9,851.9 | 10,051.3 | 9,544.9 | 8,687.6 | 8,645.2 | 8,990.3 | 8,689.4 | 8,096.5 | 7,736.7 | 7,975.6 | 7,800.5 | 8,143.6 |
| 2000 | 6,939.2 | 7,068.2 | 6,383.5 | 6,518.1 | 6,831.5 | 6,806.5 | 6,897.6 | 7,194.2 | 6,958.1 | 6,892.8 | 7,011.2 | 7,430.9 |
| 2001 | 6,669.6 | 7,172.1 | 7,369.8 | 6,888.9 | 6,422.5 | 6,904.2 | 7,114.1 | 7,330.6 | 7,056.5 | 7,079.6 | 7,424.8 | 7,723.4 |
| 2002 | 7,446.4 | 7,985.5 | 7,394.3 | 7,144.5 | 7,424.6 | 7,657.5 | 7,497.6 | 7,847.8 | 7,390.9 | 7,397.6 | 7,527.6 | 7,574.5 |
| 2003 | 6,863.6 | 6,263.6 | 6,025.4 | 6,483.1 | 7,681.9 | 7,718.3 | 7,787.8 | 7,388.2 | 6,935.4 | 7,349.3 | 7,439.4 | 7,473.7 |
| 2004 | 6,467.5 | 6,389.3 | 6,189.5 | 6,031.4 | 5,544.0 | 5,629.4 | 5,913.4 | 6,133.1 | 5,956.8 | 5,534.4 | 5,398.3 | 5,796.9 |
| 2005 | 5,443.4 | 5,703.0 | 5,369.2 | 5,162.9 | 5,441.3 | 5,629.0 | 5,451.1 | 5,106.9 | 4,636.3 | 4,716.7 | 5,123.1 | 5,147.8 |
| 2006 | 4,732.8 | 5,136.3 | 5,078.2 | 4,808.6 | 4,642.4 | 4,918.8 | 4,771.0 | 4,831.0 | 5,087.9 | 5,197.6 | 5,094.6 | 4,916.8 |
| 2007 | 4,685.1 | 4,842.0 | 4,749.9 | 4,576.7 | 4,512.2 | 4,878.5 | 4,818.9 | 5,108.5 | 4,949.0 | 4,834.8 | 4,414.4 | 4,367.9 |
| 2008 | 4,246.5 | 4,443.4 | 4,211.5 | 4,126.7 | 3,920.3 | 3,767.3 | 3,786.1 | 4,087.2 | 4,379.0 | 4,183.6 | 4,341.5 | 4,526.5 |
| 2009 | 4,061.1 | 3,977.8 | 4,161.8 | 4,123.5 | 4,063.6 | 3,893.6 | 3,995.5 | 3,955.0 | 3,920.1 | 3,851.5 | 3,740.8 | 3,725.4 |
| 2010 | 3,309.6 | 3,300.7 | 3,423.7 | 3,475.0 | 3,560.8 | 3,631.2 | 3,588.9 | 3,545.1 | 3,491.8 | 3,376.4 | 3,241.6 | 3,095.9 |
| 2011 | 2,879.5 | 2,963.0 | 2,880.9 | 2,858.3 | 2,870.0 | 3,096.7 | 3,169.9 | 3,129.5 | 3,137.1 | 2,835.0 | 2,696.8 | 2,641.1 |
| 2012 | 2,413.3 | 2,440.7 | 2,412.5 | 2,458.3 | 2,595.3 | 2,743.1 | 2,713.6 | 2,686.1 | 2,578.2 | 2,258.6 | 2,256.3 | 2,338.9 |
| 2013 | 2,237.8 | 2,238.5 | 2,337.3 | 2,427.6 | 2,185.7 | 2,151.1 | 2,125.1 | 2,197.0 | 2,098.8 | 2,116.6 | 2,118.3 | 1,601.8 |
| 2014 | 1,574.4 | 1,588.1 | 1,636.5 | 1,663.4 | 1,773.7 | 1,780.1 | 1,798.9 | 1,879.7 | 1,881.2 | 2,490.8 | 2,449.7 | 2,502.2 |
| 2015 | 2,453.1 | 2,460.3 | 2,478.2 | 2,562.2 | 2,586.9 | 2,602.2 | 2,628.3 | 2,652.0 | 2,654.4 | 2,638.5 | 2,624.5 | 2,621.2 |
| 2016 | 2,532.6 | 2,723.3 | 2,710.4 | 2,748.1 | 2,771.3 | 2,847.9 | 2,835.1 | 2,860.7 | 2,872.9 | 2,706.7 | 2,579.9 | 2,523.3 |
| 2017 | 2,346.9 | 2,428.5 | 2,517.4 | 2,541.5 | 2,625.5 | 2,717.0 | 2,683.3 | 2,669.5 | 2,560.2 | 2,567.9 | 2,421.0 | 2,414.5 |
| 2018 | 2,253.1 | 2,305.8 | 2,434.9 | 2,381.8 | 2,459.6 | 2,521.4 | 2,508.8 | 2,570.1 | 2,504.9 | 2,401.2 | 2,405.2 | 2,472.6 |
| 2019 | 2,363.6 | 2,434.4 | 2,509.9 | 2,399.4 | 2,440.5 | 2,531.3 | 2,516.8 | 2,683.5 | 2,536.6 | 2,375.6 | 2,335.8 | 2,319.7 |
| 2020 | 2,256.3 | 2,331.3 | 1,916.6 | 1,362.2 | 1,817.4 | 2,177.1 | 2,347.3 | 2,384.4 | 2,364.1 | 2,370.7 | 2,196.2 | 2,152.5 |
| 2021 | 2,046.7 | 2,047.7 | 2,201.4 | 2,327.1 | 1,568.3 | 917.1 | 876.5 | 859.4 | 878.8 | 832.6 | 777.2 | 765.0 |
| 2022 | 773.2 | 815.2 | 755.9 | |||||||||
| - = No Data Reported; -- = Not Applicable; NA = Not Available; W = Withheld to avoid disclosure of individual company data. |
| Release Date: 6/1/2022 |
| Next Release Date: TBD |