|
Download Data (XLS File) |
|
||||||||
|
||||||||
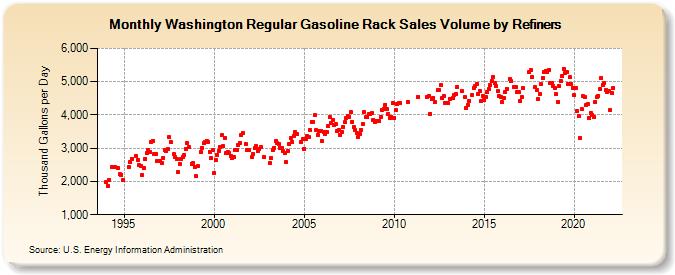
| Washington Regular Gasoline Rack Sales Volume by Refiners (Thousand Gallons per Day) | ||||||||
| Year | Jan | Feb | Mar | Apr | May | Jun | Jul | Aug | Sep | Oct | Nov | Dec |
|---|---|---|---|---|---|---|---|---|---|---|---|---|
| 1994 | 1,970.7 | 1,864.4 | 2,045.5 | W | 2,431.3 | W | 2,438.4 | W | 2,393.1 | 2,221.9 | 2,198.8 | 2,040.6 |
| 1995 | W | W | W | 2,437.4 | 2,574.2 | 2,676.3 | W | W | 2,767.0 | 2,645.6 | 2,494.2 | 2,477.4 |
| 1996 | 2,200.1 | 2,404.3 | 2,687.3 | 2,850.3 | 2,935.8 | 2,898.6 | 3,195.5 | 3,226.0 | 2,821.4 | 2,811.0 | 2,604.9 | W |
| 1997 | 2,608.2 | 2,554.9 | 2,716.4 | 2,943.2 | 2,921.6 | 2,969.3 | 3,323.2 | 3,180.5 | W | 2,811.9 | 2,742.1 | 2,673.3 |
| 1998 | 2,275.0 | 2,537.8 | 2,676.6 | 2,722.5 | 2,791.8 | 2,985.2 | 3,143.9 | 3,036.5 | W | 2,530.3 | 2,550.3 | 2,420.0 |
| 1999 | 2,155.0 | 2,457.3 | W | 2,876.5 | 3,006.8 | 3,143.6 | 3,182.1 | 3,227.7 | 3,193.8 | 2,897.0 | 2,704.8 | 2,937.4 |
| 2000 | 2,257.3 | 2,658.2 | 2,807.7 | 2,923.7 | 3,043.6 | 3,387.9 | 3,052.5 | 3,310.0 | 2,866.5 | 2,893.2 | 2,849.9 | 2,773.2 |
| 2001 | 2,702.5 | 2,746.2 | 2,957.5 | 2,946.8 | 3,108.6 | 3,164.6 | 3,394.2 | 3,454.3 | W | 3,132.7 | 2,950.1 | 2,942.8 |
| 2002 | W | 2,732.8 | 2,831.4 | 2,993.5 | 3,061.9 | 2,913.6 | 2,976.2 | 3,032.4 | W | 2,730.9 | W | W |
| 2003 | W | 2,551.7 | 2,707.3 | 2,937.2 | 3,018.2 | 3,209.8 | 3,147.4 | 3,139.4 | 2,998.5 | 3,008.8 | 2,918.1 | 2,853.6 |
| 2004 | 2,577.4 | 2,919.0 | 3,134.4 | 3,308.0 | 3,190.4 | 3,380.7 | 3,485.1 | 3,432.4 | W | W | 3,180.0 | 3,268.8 |
| 2005 | 2,985.0 | 3,281.9 | 3,359.5 | 3,327.1 | 3,552.4 | 3,792.6 | 3,793.0 | 3,983.2 | 3,545.8 | 3,410.5 | 3,521.9 | 3,519.5 |
| 2006 | 3,210.4 | 3,489.5 | 3,416.9 | 3,501.3 | 3,659.9 | 3,925.2 | 3,759.6 | 3,850.7 | 3,697.3 | 3,716.9 | 3,509.4 | 3,545.1 |
| 2007 | 3,382.1 | 3,500.2 | 3,640.5 | 3,778.2 | 3,901.5 | 3,965.8 | 3,943.1 | 4,075.7 | 3,793.7 | 3,638.9 | 3,553.2 | 3,464.1 |
| 2008 | 3,332.4 | 3,439.0 | 3,558.6 | 3,728.7 | 4,079.9 | 3,923.6 | 3,925.5 | 4,031.7 | 4,016.1 | 4,063.1 | 3,853.7 | 3,787.8 |
| 2009 | 3,828.4 | 3,810.2 | 3,818.5 | 3,948.3 | 4,152.4 | 4,190.4 | 4,309.2 | 4,165.6 | 4,032.9 | 3,911.5 | 3,949.3 | 4,353.7 |
| 2010 | 3,920.6 | 4,150.0 | 4,327.9 | 4,360.3 | 4,352.8 | W | W | W | W | 4,391.4 | W | W |
| 2011 | W | W | W | W | 4,547.3 | W | W | W | W | W | 4,528.4 | 4,566.6 |
| 2012 | 4,028.7 | 4,490.8 | 4,518.6 | 4,389.0 | W | 4,743.8 | 4,744.5 | 4,903.5 | 4,501.1 | 4,573.1 | 4,371.9 | 4,365.0 |
| 2013 | 4,343.6 | 4,487.6 | W | 4,498.2 | 4,589.7 | 4,642.3 | 4,839.6 | W | W | 4,712.6 | W | 4,532.6 |
| 2014 | 4,218.5 | 4,311.3 | 4,425.8 | W | 4,593.9 | 4,817.9 | 4,880.2 | 4,923.1 | 4,626.9 | 4,716.5 | 4,405.5 | 4,574.6 |
| 2015 | 4,446.4 | 4,538.6 | 4,681.9 | 4,774.5 | 4,895.4 | 5,007.7 | 5,140.3 | 4,951.2 | 4,884.0 | 4,712.3 | 4,563.6 | 4,542.2 |
| 2016 | 4,386.7 | 4,517.6 | 4,679.3 | 4,791.9 | W | 5,080.2 | 5,004.7 | W | 4,848.7 | 4,840.3 | 4,677.6 | 4,676.0 |
| 2017 | 4,409.8 | 4,530.4 | 4,799.9 | W | W | W | 5,279.4 | 5,349.0 | 5,125.4 | W | 4,828.7 | 4,759.4 |
| 2018 | 4,483.6 | 4,637.8 | 4,918.7 | 5,112.7 | 5,280.0 | 5,331.3 | 5,302.2 | 5,364.8 | 4,951.1 | 4,950.7 | 4,855.5 | 4,805.3 |
| 2019 | 4,618.0 | 4,391.3 | 4,874.7 | 5,028.8 | 5,161.7 | 5,391.7 | 5,254.4 | 5,302.8 | 4,932.3 | 5,129.1 | 4,944.2 | 4,813.2 |
| 2020 | 4,586.7 | 4,813.6 | 4,114.6 | 3,953.9 | 3,306.2 | 4,166.0 | 4,556.6 | 4,531.6 | 4,299.3 | 4,336.3 | 3,898.4 | 4,058.6 |
| 2021 | 3,990.5 | 3,929.5 | 4,399.2 | 4,535.7 | 4,572.8 | 4,769.8 | 5,111.7 | 4,909.8 | 4,946.7 | 4,742.8 | 4,693.6 | 4,717.4 |
| 2022 | 4,138.4 | 4,653.4 | 4,815.1 | |||||||||
| - = No Data Reported; -- = Not Applicable; NA = Not Available; W = Withheld to avoid disclosure of individual company data. |
| Release Date: 6/1/2022 |
| Next Release Date: TBD |