|
Download Data (XLS File) |
|
||||||||
|
||||||||
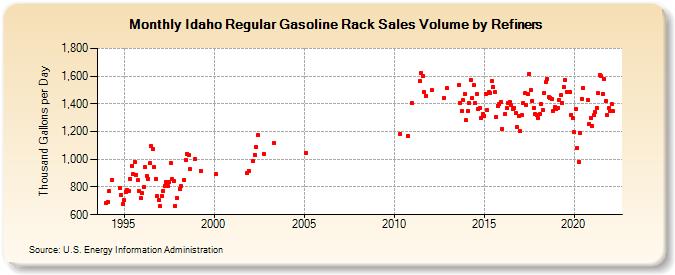
| Idaho Regular Gasoline Rack Sales Volume by Refiners (Thousand Gallons per Day) | ||||||||
| Year | Jan | Feb | Mar | Apr | May | Jun | Jul | Aug | Sep | Oct | Nov | Dec |
|---|---|---|---|---|---|---|---|---|---|---|---|---|
| 1994 | 687.2 | 694.9 | 767.9 | W | 853.1 | W | W | W | W | 789.6 | 743.4 | 673.7 |
| 1995 | 702.6 | 765.0 | 779.6 | 768.1 | 857.9 | 954.4 | 892.3 | 983.7 | 888.8 | 848.5 | 768.5 | 717.6 |
| 1996 | 754.6 | 797.9 | 941.2 | 879.5 | 860.5 | 970.2 | 1,096.4 | 1,073.8 | 944.5 | 860.1 | 732.6 | 704.0 |
| 1997 | 661.5 | 735.3 | 772.0 | 808.7 | 836.3 | 810.2 | 832.5 | 975.5 | 854.6 | 843.3 | 666.4 | 721.4 |
| 1998 | W | 786.6 | 806.7 | W | 853.3 | 995.9 | 1,038.6 | 1,032.3 | 927.1 | W | W | 999.6 |
| 1999 | W | W | W | 918.9 | W | W | W | W | W | W | W | W |
| 2000 | W | 891.4 | W | W | W | W | W | W | W | W | W | W |
| 2001 | W | W | W | W | W | W | W | W | W | W | 900.2 | 918.5 |
| 2002 | W | W | 989.0 | 1,034.4 | 1,087.9 | 1,173.3 | W | W | W | 1,040.3 | W | W |
| 2003 | W | W | W | W | 1,121.0 | W | W | W | W | W | W | W |
| 2004 | W | W | W | W | W | W | W | W | W | W | W | W |
| 2005 | W | 1,048.1 | W | W | W | W | W | W | W | W | W | W |
| 2006 | W | W | W | W | W | W | W | W | W | W | W | W |
| 2007 | W | W | W | W | W | W | W | W | W | W | W | W |
| 2008 | W | W | W | W | W | W | W | W | W | W | W | W |
| 2009 | W | W | W | W | W | W | W | W | W | W | W | W |
| 2010 | W | W | W | W | 1,185.6 | W | W | W | W | 1,168.2 | W | W |
| 2011 | 1,402.5 | W | W | W | W | 1,561.5 | 1,622.7 | 1,600.0 | 1,484.7 | 1,459.7 | W | W |
| 2012 | W | 1,500.2 | W | W | W | W | W | W | W | 1,443.0 | W | 1,513.4 |
| 2013 | W | W | W | W | W | W | W | 1,536.9 | 1,409.0 | 1,349.1 | 1,427.6 | 1,474.2 |
| 2014 | 1,280.4 | 1,348.5 | 1,405.1 | 1,573.1 | 1,440.8 | 1,534.3 | 1,404.0 | 1,467.9 | 1,360.4 | 1,370.5 | 1,297.3 | 1,327.3 |
| 2015 | 1,313.3 | 1,472.0 | 1,354.7 | 1,482.0 | 1,479.9 | 1,561.9 | 1,524.3 | 1,483.2 | 1,305.5 | 1,386.8 | 1,398.4 | 1,413.8 |
| 2016 | 1,221.5 | W | 1,327.3 | 1,371.9 | 1,408.6 | 1,414.3 | 1,389.6 | 1,363.5 | 1,369.8 | 1,336.2 | 1,232.8 | 1,309.8 |
| 2017 | 1,201.7 | 1,319.0 | 1,408.4 | 1,474.7 | 1,390.0 | 1,469.9 | 1,618.4 | 1,500.3 | 1,423.1 | 1,372.1 | 1,327.2 | 1,319.9 |
| 2018 | 1,297.2 | 1,328.9 | 1,398.3 | 1,354.4 | 1,481.4 | 1,556.7 | 1,577.8 | 1,445.9 | 1,443.0 | 1,438.2 | 1,345.9 | 1,376.2 |
| 2019 | 1,361.5 | 1,370.7 | 1,427.1 | 1,463.4 | 1,404.9 | 1,520.6 | 1,571.4 | 1,484.7 | 1,485.7 | 1,485.6 | 1,322.4 | 1,295.8 |
| 2020 | 1,194.3 | 1,360.1 | 1,079.5 | 981.3 | 1,187.2 | 1,437.5 | 1,516.8 | W | W | 1,428.8 | 1,251.3 | 1,297.9 |
| 2021 | 1,237.3 | 1,317.1 | 1,341.9 | 1,370.7 | 1,475.3 | 1,607.9 | 1,598.7 | 1,470.2 | 1,576.0 | 1,420.8 | 1,317.4 | 1,366.5 |
| 2022 | 1,349.7 | 1,395.7 | 1,345.9 | |||||||||
| - = No Data Reported; -- = Not Applicable; NA = Not Available; W = Withheld to avoid disclosure of individual company data. |
| Release Date: 6/1/2022 |
| Next Release Date: TBD |