|
Download Data (XLS File) |
|
||||||||
|
||||||||
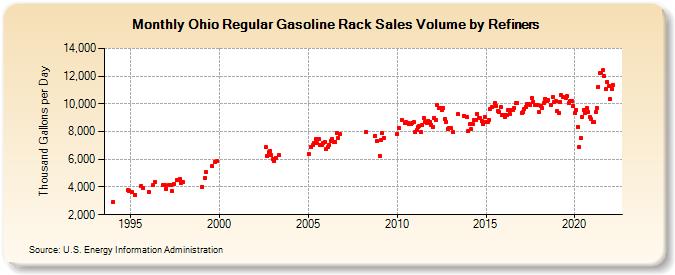
| Ohio Regular Gasoline Rack Sales Volume by Refiners (Thousand Gallons per Day) | ||||||||
| Year | Jan | Feb | Mar | Apr | May | Jun | Jul | Aug | Sep | Oct | Nov | Dec |
|---|---|---|---|---|---|---|---|---|---|---|---|---|
| 1994 | 2,917.5 | W | W | W | W | W | W | W | W | W | 3,750.1 | 3,721.6 |
| 1995 | W | 3,607.3 | W | 3,424.3 | W | W | W | 4,072.0 | 3,895.8 | W | W | W |
| 1996 | 3,609.7 | W | W | 4,155.4 | 4,363.6 | W | W | W | W | W | 4,143.1 | 4,121.0 |
| 1997 | 3,879.9 | W | 4,115.8 | 4,125.9 | 3,679.4 | 4,239.7 | W | 4,474.3 | 4,509.6 | 4,584.7 | 4,291.4 | 4,384.6 |
| 1998 | W | W | W | W | W | W | W | W | W | W | W | W |
| 1999 | 4,031.7 | W | 4,661.6 | 5,049.6 | W | W | W | 5,498.4 | W | 5,805.7 | 5,903.3 | W |
| 2000 | W | W | W | W | W | W | W | W | W | W | W | W |
| 2001 | W | W | W | W | W | W | W | W | W | W | W | W |
| 2002 | W | W | W | W | W | W | W | 6,857.8 | 6,257.2 | 6,490.6 | 6,596.5 | 6,277.3 |
| 2003 | 6,018.1 | 5,871.0 | 6,127.1 | W | 6,273.8 | W | W | W | W | W | W | W |
| 2004 | W | W | W | W | W | W | W | W | W | W | W | W |
| 2005 | 6,389.9 | W | 6,868.5 | 7,039.5 | 7,149.2 | 7,453.0 | 7,154.3 | 7,431.9 | 6,999.9 | 7,059.1 | 7,165.5 | 7,236.9 |
| 2006 | 6,743.4 | 6,903.9 | 7,042.3 | 7,314.3 | 7,453.9 | 7,258.0 | 7,261.9 | 7,916.1 | 7,528.9 | 7,801.5 | W | W |
| 2007 | W | W | W | W | W | W | W | W | W | W | W | W |
| 2008 | W | W | W | 7,973.0 | W | W | W | W | W | 7,707.3 | 7,297.2 | W |
| 2009 | 6,268.3 | 7,402.6 | 7,860.7 | 7,561.0 | W | W | W | W | W | W | W | W |
| 2010 | 7,828.4 | 8,242.5 | W | 8,853.7 | W | 8,633.6 | 8,672.0 | 8,587.9 | 8,514.8 | 8,568.1 | 8,597.4 | 8,682.3 |
| 2011 | 7,932.8 | 8,083.6 | 8,299.6 | 8,425.7 | 7,935.6 | 8,454.8 | 8,983.0 | 8,683.3 | 8,618.1 | 8,793.5 | 8,721.2 | 8,474.6 |
| 2012 | 8,319.4 | 9,003.6 | 8,806.1 | 9,888.4 | 9,687.3 | 9,730.3 | 9,550.1 | 9,692.5 | 8,893.8 | 8,684.8 | 8,164.8 | 8,270.8 |
| 2013 | 8,288.3 | W | 7,959.8 | W | W | 9,247.2 | W | W | W | 9,155.5 | W | 9,037.1 |
| 2014 | 8,038.6 | 8,524.6 | 8,160.5 | 8,521.0 | 8,852.9 | 8,853.6 | 9,288.5 | 8,985.1 | 8,951.4 | 8,740.4 | 8,510.2 | 9,080.4 |
| 2015 | 8,696.7 | 8,706.9 | 8,863.4 | 9,662.9 | 9,757.6 | W | 10,087.6 | 9,828.9 | 9,506.9 | 9,435.3 | 9,757.5 | 9,179.1 |
| 2016 | 9,174.6 | 9,050.4 | 9,193.8 | 9,525.7 | 9,297.0 | 9,553.8 | 9,523.6 | 9,711.7 | 10,046.5 | 10,043.2 | W | W |
| 2017 | 9,371.7 | 9,408.7 | 9,626.8 | 9,789.1 | 9,957.1 | 9,966.5 | 9,907.3 | 10,438.3 | 10,137.0 | 9,896.2 | 9,886.4 | 9,890.0 |
| 2018 | 9,394.5 | 9,821.4 | 9,671.0 | 10,044.3 | 10,362.8 | 10,237.4 | 10,267.1 | W | 9,914.2 | 10,513.9 | 10,120.4 | 10,176.2 |
| 2019 | 9,463.7 | 9,340.6 | 10,164.3 | 10,615.5 | 10,459.4 | W | 10,445.3 | 10,529.4 | 10,026.5 | 10,187.2 | 10,173.3 | 9,870.2 |
| 2020 | 9,327.2 | 9,543.3 | 8,329.2 | 6,892.4 | 7,548.0 | 9,077.8 | 9,536.5 | 9,303.2 | 9,681.1 | 9,438.9 | 9,038.5 | 8,872.5 |
| 2021 | 8,693.6 | 8,686.4 | 9,426.1 | 9,665.8 | 11,235.6 | 12,203.0 | 12,224.6 | 12,413.6 | 11,977.9 | 11,036.9 | 11,590.2 | 11,300.5 |
| 2022 | 10,342.5 | 11,084.2 | 11,376.5 | |||||||||
| - = No Data Reported; -- = Not Applicable; NA = Not Available; W = Withheld to avoid disclosure of individual company data. |
| Release Date: 6/1/2022 |
| Next Release Date: TBD |