|
Download Data (XLS File) |
|
||||||||
|
||||||||
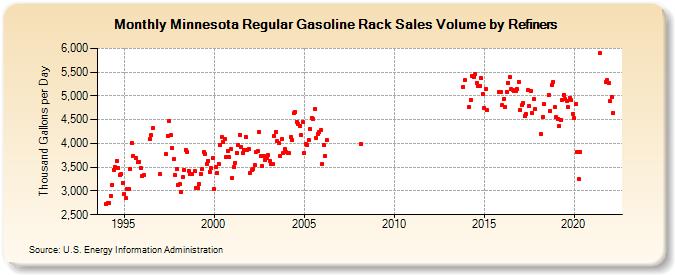
| Minnesota Regular Gasoline Rack Sales Volume by Refiners (Thousand Gallons per Day) | ||||||||
| Year | Jan | Feb | Mar | Apr | May | Jun | Jul | Aug | Sep | Oct | Nov | Dec |
|---|---|---|---|---|---|---|---|---|---|---|---|---|
| 1994 | 2,720.5 | 2,737.9 | 2,747.1 | 2,902.9 | 3,132.2 | 3,449.3 | 3,507.6 | 3,640.6 | 3,488.8 | 3,330.8 | 3,348.2 | 3,173.6 |
| 1995 | 2,931.8 | 2,844.2 | 3,050.8 | 3,042.3 | 3,452.7 | 4,005.1 | 3,738.8 | W | 3,689.3 | 3,607.9 | 3,617.3 | 3,482.1 |
| 1996 | 3,304.3 | 3,326.9 | W | W | W | 4,089.4 | 4,172.1 | 4,321.0 | W | W | W | W |
| 1997 | 3,352.0 | W | W | W | 3,774.0 | 4,166.8 | 4,469.4 | 4,167.1 | 3,913.9 | 3,677.2 | 3,330.4 | 3,458.0 |
| 1998 | 3,132.3 | 3,136.5 | 2,971.4 | 3,284.4 | 3,444.3 | 3,862.3 | 3,810.8 | 3,428.9 | 3,352.6 | 3,351.5 | W | 3,409.4 |
| 1999 | 3,068.9 | 3,063.6 | 3,150.5 | 3,366.0 | 3,452.2 | 3,818.8 | 3,772.7 | 3,559.7 | 3,632.2 | 3,404.7 | 3,472.9 | 3,700.6 |
| 2000 | 3,037.1 | 3,499.8 | 3,373.1 | 3,575.7 | 3,964.6 | 4,130.7 | 4,029.7 | 4,089.0 | 3,709.2 | 3,841.5 | 3,704.5 | 3,878.2 |
| 2001 | 3,280.8 | 3,498.7 | 3,591.6 | 3,807.7 | 3,957.2 | 4,186.5 | 3,926.7 | 3,799.4 | 3,862.0 | 4,142.5 | 3,865.5 | 3,874.8 |
| 2002 | 3,373.4 | 3,438.6 | 3,467.3 | 3,545.0 | 3,826.8 | 3,831.2 | 4,247.5 | 3,729.3 | 3,517.3 | 3,741.1 | 3,654.0 | 3,685.2 |
| 2003 | 3,753.6 | 3,622.1 | 3,562.5 | 3,576.9 | 4,153.4 | 4,237.8 | 4,041.6 | 4,002.6 | 3,730.2 | 4,092.2 | 3,792.8 | 3,878.2 |
| 2004 | 3,819.3 | 3,805.1 | 3,788.8 | 4,128.8 | 4,067.0 | 4,631.2 | 4,666.8 | 4,460.8 | 4,414.1 | 4,370.3 | 4,167.8 | 4,448.4 |
| 2005 | 3,808.1 | 3,987.4 | 3,976.7 | 4,081.5 | 4,300.5 | 4,540.6 | 4,510.2 | 4,725.5 | 4,108.8 | 4,206.0 | 4,240.1 | 4,277.0 |
| 2006 | 3,567.7 | 3,965.9 | 3,735.0 | 4,064.9 | W | W | W | W | W | W | W | W |
| 2007 | W | W | W | W | W | W | W | W | W | W | W | W |
| 2008 | W | W | 3,986.3 | W | W | W | W | W | W | W | W | W |
| 2009 | W | W | W | W | W | W | W | W | W | W | W | W |
| 2010 | W | W | W | W | W | W | W | W | W | W | W | W |
| 2011 | W | W | W | W | W | W | W | W | W | W | W | W |
| 2012 | W | W | W | W | W | W | W | W | W | W | W | W |
| 2013 | W | W | W | W | W | W | W | W | W | W | 5,192.6 | 5,333.9 |
| 2014 | W | W | 4,768.1 | 4,919.3 | 5,424.7 | 5,388.3 | 5,471.4 | 5,282.0 | 5,198.9 | 5,214.2 | 5,376.3 | 5,037.3 |
| 2015 | 4,748.4 | 5,153.2 | 4,694.6 | W | W | W | W | W | W | W | 5,081.1 | 5,081.1 |
| 2016 | 4,799.5 | 4,941.8 | 4,756.7 | 5,087.1 | 5,280.3 | 5,400.3 | 5,135.8 | 5,128.1 | 5,097.5 | 5,107.8 | 5,142.1 | 5,299.0 |
| 2017 | 4,706.9 | 4,801.9 | 4,857.2 | 4,569.6 | 4,615.4 | 5,120.3 | 4,784.1 | 5,104.5 | 4,643.2 | 4,937.5 | 4,718.4 | W |
| 2018 | W | W | 4,192.5 | 4,559.2 | 4,822.5 | W | W | 5,016.7 | 4,690.8 | 5,224.9 | 5,302.3 | 4,763.3 |
| 2019 | 4,552.9 | 4,518.3 | 4,371.1 | 4,497.5 | 4,917.3 | 5,019.8 | 4,929.2 | 4,899.0 | 4,763.1 | 4,957.5 | 4,904.4 | 4,626.7 |
| 2020 | 4,528.5 | 4,824.4 | 3,821.9 | 3,246.9 | 3,822.2 | W | W | W | W | W | W | W |
| 2021 | W | W | W | W | W | 5,895.1 | W | W | W | 5,293.5 | 5,325.2 | 5,282.2 |
| 2022 | 4,883.5 | 4,976.1 | 4,642.4 | |||||||||
| - = No Data Reported; -- = Not Applicable; NA = Not Available; W = Withheld to avoid disclosure of individual company data. |
| Release Date: 6/1/2022 |
| Next Release Date: TBD |