|
Download Data (XLS File) |
|
||||||||
|
||||||||
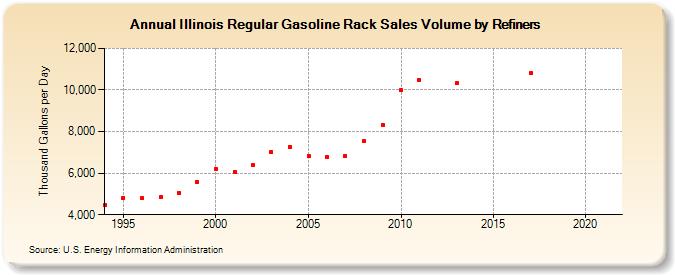
| Illinois Regular Gasoline Rack Sales Volume by Refiners (Thousand Gallons per Day) | ||||||||
| Decade | Year-0 | Year-1 | Year-2 | Year-3 | Year-4 | Year-5 | Year-6 | Year-7 | Year-8 | Year-9 |
|---|---|---|---|---|---|---|---|---|---|---|
| 1990's | 4,464.9 | 4,825.1 | 4,800.2 | 4,837.0 | 5,061.0 | 5,586.9 | ||||
| 2000's | 6,216.5 | 6,075.9 | 6,384.7 | 7,010.3 | 7,270.2 | 6,832.0 | 6,773.4 | 6,819.3 | 7,525.2 | 8,332.6 |
| 2010's | 9,988.5 | 10,491.4 | W | 10,321.1 | W | W | W | 10,807.7 | W | W |
| 2020's | W |
| - = No Data Reported; -- = Not Applicable; NA = Not Available; W = Withheld to avoid disclosure of individual company data. |
| Release Date: 6/1/2022 |
| Next Release Date: TBD |