|
Download Data (XLS File) |
|
||||||||
|
||||||||
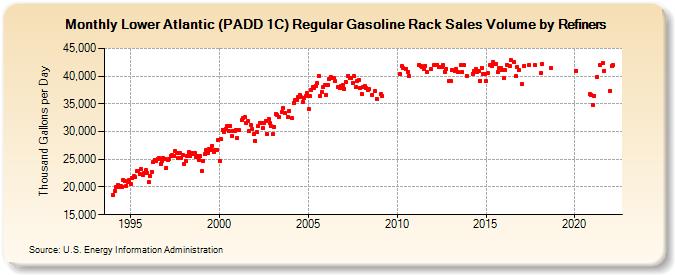
| Lower Atlantic (PADD 1C) Regular Gasoline Rack Sales Volume by Refiners (Thousand Gallons per Day) | ||||||||
| Year | Jan | Feb | Mar | Apr | May | Jun | Jul | Aug | Sep | Oct | Nov | Dec |
|---|---|---|---|---|---|---|---|---|---|---|---|---|
| 1994 | 18,575.3 | 19,308.2 | 19,981.4 | 20,323.7 | 19,995.1 | 20,237.3 | 20,002.0 | 21,223.4 | 21,012.7 | 20,227.1 | 20,823.5 | 21,288.2 |
| 1995 | 20,473.0 | 21,583.6 | 21,921.9 | 21,797.4 | 22,816.6 | 22,893.4 | 22,417.9 | 23,225.2 | 22,150.9 | 22,483.4 | 22,995.0 | 22,543.8 |
| 1996 | 20,880.6 | 21,973.5 | 22,781.4 | 24,485.6 | 24,918.7 | 24,709.7 | 25,121.9 | 25,182.6 | 24,073.0 | 24,694.0 | 25,241.2 | 25,018.1 |
| 1997 | 23,477.4 | 24,871.4 | 25,053.0 | 25,666.4 | 25,721.2 | 25,583.6 | 26,463.6 | 26,071.0 | 25,142.7 | 26,127.7 | 25,228.8 | 25,843.7 |
| 1998 | 24,232.6 | 24,766.0 | 25,618.3 | 26,293.8 | 25,571.5 | 26,201.0 | 25,869.2 | 26,050.1 | 25,478.2 | 25,600.6 | 24,923.9 | 25,565.3 |
| 1999 | 22,903.1 | 24,668.7 | 25,919.6 | 26,741.1 | 26,217.7 | 26,826.6 | 26,728.1 | 27,464.6 | 26,297.8 | 26,605.1 | 26,758.6 | 28,539.4 |
| 2000 | 24,716.5 | 28,659.0 | 30,347.1 | 29,922.9 | 30,478.9 | 30,937.1 | 30,051.6 | 31,007.0 | 29,190.2 | 30,165.2 | 30,105.3 | 30,342.7 |
| 2001 | 28,921.6 | 30,282.0 | W | 32,000.1 | 32,471.1 | 32,547.6 | 31,562.7 | 31,941.8 | 30,169.9 | 31,198.4 | 30,446.0 | 29,541.4 |
| 2002 | 28,358.0 | 29,915.3 | 30,960.2 | 31,525.1 | 31,462.6 | 30,625.2 | 31,501.2 | 31,922.5 | 29,593.6 | 32,313.2 | 31,484.6 | 30,952.8 |
| 2003 | 29,513.8 | 30,881.1 | 33,231.3 | 32,946.5 | 32,658.0 | W | 33,534.1 | 34,266.9 | 33,326.0 | W | 32,701.9 | 33,781.6 |
| 2004 | W | 32,369.1 | 35,155.5 | 35,739.5 | 35,754.7 | 36,178.2 | 36,649.3 | 36,165.5 | 35,330.2 | 35,962.5 | 36,359.2 | 36,884.5 |
| 2005 | 34,060.6 | 36,385.8 | 37,490.2 | 37,963.3 | 37,769.0 | 38,225.0 | 38,747.1 | 40,089.3 | 36,494.2 | 37,112.4 | 37,965.6 | 38,381.5 |
| 2006 | 36,558.7 | 38,334.4 | 39,398.6 | 39,873.1 | 39,585.7 | 39,572.7 | 39,091.8 | W | 37,953.4 | 37,790.5 | 38,143.3 | 38,424.0 |
| 2007 | 37,675.0 | 38,985.1 | W | 40,065.1 | 39,685.8 | 39,684.7 | 38,839.2 | 40,000.0 | 38,009.4 | 39,130.6 | 39,240.1 | 37,941.0 |
| 2008 | 36,778.0 | 38,017.0 | 38,162.8 | 37,817.8 | 37,425.2 | 37,618.8 | W | 36,614.0 | W | 37,333.0 | 35,950.7 | W |
| 2009 | W | 36,731.9 | 36,387.6 | W | W | W | W | W | W | W | W | W |
| 2010 | W | W | 40,459.4 | 41,742.0 | 41,432.9 | W | 41,336.1 | 40,788.5 | 40,005.1 | W | W | W |
| 2011 | W | W | W | 42,078.0 | 41,860.1 | 41,646.8 | 41,280.8 | 41,904.2 | 40,687.4 | W | W | 41,250.5 |
| 2012 | W | 41,915.5 | W | 42,084.2 | 41,668.1 | W | 41,559.0 | 42,014.5 | 40,831.1 | 41,288.4 | W | 39,167.9 |
| 2013 | 39,105.9 | 41,085.5 | W | 40,937.8 | 41,301.3 | 40,695.7 | W | 42,010.3 | 40,738.0 | 42,032.6 | W | 39,984.0 |
| 2014 | W | W | W | 40,434.7 | 40,894.0 | 41,216.1 | 40,715.2 | 41,001.8 | 39,192.7 | 41,539.8 | 40,400.5 | 40,397.0 |
| 2015 | 39,126.8 | 40,492.1 | W | 42,015.8 | 41,843.1 | 42,550.6 | 42,177.5 | 42,150.6 | 40,663.5 | 41,455.9 | 41,438.3 | 41,057.4 |
| 2016 | 39,588.6 | 41,142.1 | 42,072.7 | W | 41,793.1 | 42,857.7 | W | 42,530.7 | 39,969.0 | 41,584.6 | 41,098.6 | W |
| 2017 | 38,556.6 | W | 41,902.1 | W | W | 41,925.3 | W | W | W | 41,983.9 | W | W |
| 2018 | W | 40,561.9 | 42,253.4 | W | W | W | W | W | 41,425.8 | W | W | W |
| 2019 | W | W | W | W | W | W | W | W | W | W | W | W |
| 2020 | W | 40,979.1 | W | W | W | W | W | W | W | W | 36,691.3 | 36,639.9 |
| 2021 | 34,876.1 | 36,458.0 | W | 39,921.3 | W | 42,032.2 | W | 42,374.8 | 41,011.9 | W | W | W |
| 2022 | 37,369.4 | 41,769.6 | 41,935.5 | |||||||||
| - = No Data Reported; -- = Not Applicable; NA = Not Available; W = Withheld to avoid disclosure of individual company data. |
| Release Date: 6/1/2022 |
| Next Release Date: TBD |