|
Download Data (XLS File) |
|
||||||||
|
||||||||
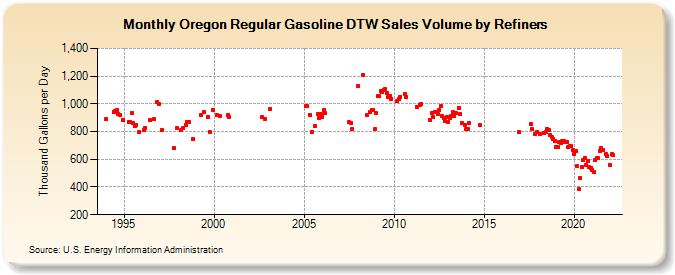
| Oregon Regular Gasoline DTW Sales Volume by Refiners (Thousand Gallons per Day) | ||||||||
| Year | Jan | Feb | Mar | Apr | May | Jun | Jul | Aug | Sep | Oct | Nov | Dec |
|---|---|---|---|---|---|---|---|---|---|---|---|---|
| 1994 | 887.3 | W | W | W | W | 942.5 | 951.6 | 955.7 | 929.6 | 917.4 | W | 879.9 |
| 1995 | W | W | W | 865.7 | 867.4 | 934.2 | 861.6 | 840.1 | 848.0 | W | 799.4 | W |
| 1996 | W | 811.1 | 828.4 | W | W | 884.2 | W | W | 889.9 | W | 1,011.0 | 1,001.1 |
| 1997 | W | 814.0 | W | W | W | W | W | W | W | 680.8 | W | 826.0 |
| 1998 | W | W | 812.0 | 825.3 | W | 848.2 | 868.7 | 871.8 | W | W | 745.9 | W |
| 1999 | W | W | W | 917.3 | W | 937.7 | W | W | 905.3 | 798.1 | W | 958.5 |
| 2000 | W | W | 916.3 | W | 909.7 | W | W | W | W | 919.9 | 907.1 | W |
| 2001 | W | W | W | W | W | W | W | W | W | W | W | W |
| 2002 | W | W | W | W | W | W | W | W | 902.7 | W | 893.3 | W |
| 2003 | W | 961.4 | W | W | W | W | W | W | W | W | W | W |
| 2004 | W | W | W | W | W | W | W | W | NA | NA | W | W |
| 2005 | W | 986.3 | 984.3 | W | 917.8 | 793.7 | W | 840.0 | W | 923.7 | 898.6 | 925.0 |
| 2006 | 906.0 | 952.5 | 933.7 | W | W | W | W | W | W | W | W | W |
| 2007 | W | W | W | W | W | W | 867.1 | 863.3 | 819.6 | W | W | W |
| 2008 | 1,127.1 | W | W | 1,210.4 | W | W | 921.1 | W | 942.2 | 956.0 | 955.2 | 816.4 |
| 2009 | 935.3 | 1,053.9 | 1,056.0 | 1,089.8 | 1,082.7 | 1,100.4 | 1,103.6 | 1,081.5 | 1,050.9 | 1,060.0 | 1,035.5 | W |
| 2010 | W | W | 1,018.3 | 1,034.8 | 1,051.7 | W | W | 1,071.2 | 1,048.2 | W | W | NA |
| 2011 | W | W | W | 979.8 | W | 993.8 | 995.7 | W | W | W | W | W |
| 2012 | 886.2 | 930.3 | 906.6 | 944.0 | 937.5 | 924.0 | 956.6 | 984.5 | 911.6 | 895.7 | 876.0 | 903.5 |
| 2013 | 871.3 | 898.3 | 909.5 | 940.5 | 909.7 | 930.5 | W | 973.3 | 928.9 | 861.5 | W | 849.7 |
| 2014 | 819.1 | 821.5 | 860.3 | W | W | W | W | W | W | 843.9 | W | W |
| 2015 | W | W | W | W | W | W | W | W | W | W | W | W |
| 2016 | W | W | W | W | W | W | W | W | W | W | W | 794.0 |
| 2017 | W | W | W | W | W | W | W | 854.5 | 816.4 | W | 785.4 | 796.2 |
| 2018 | W | 784.0 | W | W | 791.5 | 798.9 | 821.9 | 811.0 | 776.0 | 760.7 | 744.1 | 731.2 |
| 2019 | 685.3 | 688.4 | 721.2 | 718.0 | 728.6 | 734.6 | 726.5 | 727.1 | 687.3 | 694.9 | 695.1 | 665.6 |
| 2020 | 636.9 | 659.8 | 548.8 | 386.2 | 467.9 | 542.9 | 592.4 | 608.6 | 558.5 | 585.2 | 540.8 | 538.2 |
| 2021 | 525.8 | 509.2 | 594.2 | 606.9 | 606.8 | 660.1 | 684.1 | 667.4 | W | 636.3 | 624.3 | W |
| 2022 | 557.4 | 634.6 | 628.7 | |||||||||
| - = No Data Reported; -- = Not Applicable; NA = Not Available; W = Withheld to avoid disclosure of individual company data. |
| Release Date: 6/1/2022 |
| Next Release Date: TBD |