|
Download Data (XLS File) |
|
||||||||
|
||||||||
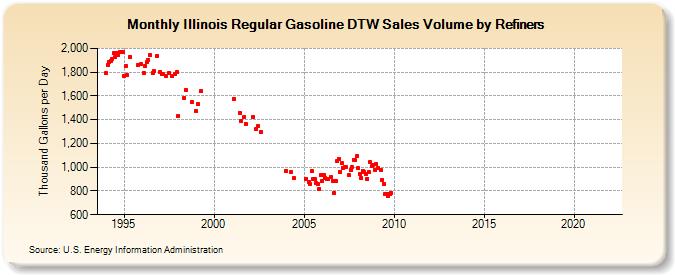
| Illinois Regular Gasoline DTW Sales Volume by Refiners (Thousand Gallons per Day) | ||||||||
| Year | Jan | Feb | Mar | Apr | May | Jun | Jul | Aug | Sep | Oct | Nov | Dec |
|---|---|---|---|---|---|---|---|---|---|---|---|---|
| 1994 | 1,790.4 | 1,860.6 | 1,887.5 | 1,891.9 | 1,914.4 | 1,957.8 | 1,924.5 | 1,961.4 | 1,941.8 | 1,972.7 | 1,969.7 | 1,970.6 |
| 1995 | 1,765.3 | 1,852.9 | 1,772.6 | W | 1,931.4 | W | W | W | W | 1,860.5 | W | 1,866.6 |
| 1996 | W | 1,795.8 | 1,851.9 | 1,882.8 | 1,905.2 | 1,945.4 | W | 1,795.3 | 1,805.8 | W | 1,933.9 | W |
| 1997 | 1,799.9 | 1,780.5 | 1,780.8 | W | 1,769.2 | W | 1,794.1 | W | 1,765.2 | W | 1,785.6 | 1,799.0 |
| 1998 | 1,434.4 | W | W | W | 1,584.9 | 1,650.9 | W | W | W | 1,546.0 | W | W |
| 1999 | 1,472.7 | 1,530.9 | W | 1,637.7 | W | W | W | W | W | W | W | W |
| 2000 | W | W | W | W | W | W | W | W | W | W | W | W |
| 2001 | W | 1,577.8 | W | W | W | 1,459.0 | 1,387.4 | W | 1,424.2 | 1,366.3 | W | W |
| 2002 | W | W | 1,421.7 | W | 1,319.1 | 1,344.8 | W | 1,300.3 | W | W | W | W |
| 2003 | W | W | W | W | W | W | W | W | W | W | W | W |
| 2004 | 969.5 | W | W | 955.5 | W | 910.6 | W | W | W | W | W | W |
| 2005 | W | 903.1 | W | 878.5 | 857.2 | 968.4 | 900.2 | 896.7 | 869.6 | 860.7 | 820.3 | 930.1 |
| 2006 | 882.8 | 935.0 | 907.7 | 898.4 | 904.8 | W | 918.7 | 886.1 | 782.9 | 886.2 | 1,049.3 | 1,072.5 |
| 2007 | 961.2 | 1,038.0 | 995.8 | 999.9 | 1,003.1 | W | 933.6 | 977.7 | 997.9 | 1,064.5 | 1,056.4 | 1,090.8 |
| 2008 | 989.5 | 944.3 | 912.5 | 966.1 | 959.0 | 944.6 | 904.0 | 959.8 | 1,039.6 | 1,010.0 | 1,021.5 | 976.7 |
| 2009 | 1,030.8 | 993.5 | W | 976.5 | 894.8 | 860.8 | 774.4 | 777.3 | 755.2 | 777.5 | 785.7 | W |
| 2010 | W | W | W | W | W | W | W | W | W | W | W | W |
| 2011 | W | W | W | - | W | - | W | W | W | W | - | - |
| 2012 | - | - | W | - | - | - | - | W | - | W | - | - |
| 2013 | - | - | W | W | - | - | - | - | - | - | - | - |
| 2014 | - | - | - | - | - | - | - | - | - | - | - | - |
| 2015 | - | - | - | - | - | - | - | - | - | - | - | - |
| 2016 | - | - | - | - | - | - | - | - | - | - | - | - |
| 2017 | - | - | - | - | - | - | - | - | - | - | - | - |
| 2018 | - | - | - | - | - | - | - | - | - | - | - | - |
| 2019 | - | - | - | - | - | - | - | - | - | - | - | - |
| 2020 | - | - | - | - | - | - | - | - | - | - | - | - |
| 2021 | - | - | - | - | - | - | - | - | - | - | - | - |
| 2022 | - | - | - | |||||||||
| - = No Data Reported; -- = Not Applicable; NA = Not Available; W = Withheld to avoid disclosure of individual company data. |
| Release Date: 6/1/2022 |
| Next Release Date: TBD |