|
Download Data (XLS File) |
|
||||||||
|
||||||||
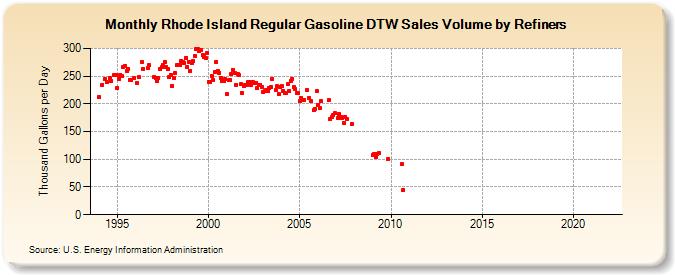
| Rhode Island Regular Gasoline DTW Sales Volume by Refiners (Thousand Gallons per Day) | ||||||||
| Year | Jan | Feb | Mar | Apr | May | Jun | Jul | Aug | Sep | Oct | Nov | Dec |
|---|---|---|---|---|---|---|---|---|---|---|---|---|
| 1994 | 211.5 | W | 234.7 | W | 244.6 | 239.0 | W | 246.3 | 241.9 | W | 252.9 | 251.8 |
| 1995 | 228.5 | 244.8 | 252.6 | 249.7 | 266.5 | 268.7 | 259.7 | 263.4 | 243.7 | 242.8 | W | 246.3 |
| 1996 | W | 237.6 | 247.5 | W | 275.7 | 263.3 | W | W | 265.4 | 269.2 | W | W |
| 1997 | 248.6 | 246.7 | 241.6 | 246.4 | 263.7 | 266.0 | 270.7 | 274.7 | 266.4 | 262.5 | 248.3 | 252.8 |
| 1998 | 232.7 | 246.1 | 255.5 | 269.3 | 270.7 | 270.6 | 277.8 | 275.2 | 273.8 | 283.4 | 266.6 | 275.5 |
| 1999 | 259.7 | 272.9 | 276.9 | 286.7 | 298.0 | 298.3 | 295.9 | 296.8 | 287.4 | 285.3 | 282.9 | 291.4 |
| 2000 | 239.6 | 240.0 | 250.5 | 243.1 | 257.2 | 276.1 | 258.8 | 256.1 | 247.1 | 241.1 | 241.1 | 244.0 |
| 2001 | 217.0 | 242.2 | 242.9 | 253.4 | 261.6 | 255.7 | 234.6 | 254.3 | 251.3 | 235.1 | 219.9 | 233.0 |
| 2002 | 234.0 | 234.8 | 239.2 | 238.5 | 234.8 | 239.2 | 237.2 | 238.1 | 227.7 | 233.4 | 234.7 | 231.1 |
| 2003 | 222.2 | 223.8 | 224.5 | 222.6 | 228.3 | 230.4 | 245.2 | W | 224.9 | 231.3 | 217.0 | 229.8 |
| 2004 | 232.5 | 224.0 | 220.1 | 219.7 | 235.0 | 223.6 | 240.8 | 245.2 | 230.0 | 227.3 | 219.1 | 219.5 |
| 2005 | 205.7 | 211.4 | 206.7 | 207.3 | W | 224.4 | 210.7 | 205.6 | W | 188.1 | 191.2 | 222.7 |
| 2006 | 198.7 | 192.2 | 204.5 | W | W | W | W | 206.3 | 172.9 | 177.0 | 180.1 | 182.9 |
| 2007 | W | 174.4 | 181.3 | 177.0 | 175.1 | 165.7 | 176.5 | 172.3 | W | W | 163.3 | W |
| 2008 | W | W | W | W | W | W | W | W | W | W | W | W |
| 2009 | 107.4 | 110.3 | 103.2 | 110.4 | 111.1 | W | W | W | W | W | 100.5 | W |
| 2010 | W | W | W | W | W | W | W | 90.7 | 44.9 | W | W | W |
| 2011 | W | W | W | W | W | W | W | W | W | W | W | W |
| 2012 | W | W | W | W | W | W | W | W | W | W | W | W |
| 2013 | W | W | W | W | W | W | W | W | W | W | W | W |
| 2014 | W | W | W | W | W | W | W | W | W | W | W | W |
| 2015 | W | W | W | W | W | W | W | W | W | W | W | W |
| 2016 | W | W | W | W | W | W | W | W | W | W | W | W |
| 2017 | W | W | W | W | W | W | W | W | W | - | - | - |
| 2018 | - | - | - | - | - | - | - | - | - | - | - | - |
| 2019 | - | - | - | - | - | - | - | - | - | - | - | - |
| 2020 | - | - | - | - | - | - | - | - | - | - | - | - |
| 2021 | - | - | - | - | - | - | - | - | - | - | - | - |
| 2022 | - | - | - | |||||||||
| - = No Data Reported; -- = Not Applicable; NA = Not Available; W = Withheld to avoid disclosure of individual company data. |
| Release Date: 6/1/2022 |
| Next Release Date: TBD |