|
Download Data (XLS File) |
|
||||||||
|
||||||||
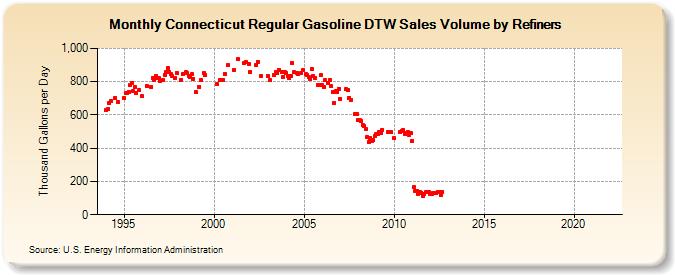
| Connecticut Regular Gasoline DTW Sales Volume by Refiners (Thousand Gallons per Day) | ||||||||
| Year | Jan | Feb | Mar | Apr | May | Jun | Jul | Aug | Sep | Oct | Nov | Dec |
|---|---|---|---|---|---|---|---|---|---|---|---|---|
| 1994 | 632.2 | 634.0 | 669.8 | 684.4 | W | W | 700.8 | W | 679.0 | W | W | W |
| 1995 | 703.0 | 732.2 | 734.5 | 739.8 | 778.5 | 794.9 | 743.0 | 768.0 | 734.2 | W | 749.9 | W |
| 1996 | 711.0 | W | W | 772.9 | W | W | 769.8 | 823.1 | 809.9 | 835.5 | 823.0 | 820.0 |
| 1997 | 804.6 | W | 807.7 | 842.1 | 858.1 | 882.5 | 859.1 | 843.4 | 833.4 | W | 822.1 | 854.7 |
| 1998 | W | W | 812.3 | 844.8 | W | 856.9 | 849.7 | 837.0 | 830.8 | 843.8 | 818.4 | W |
| 1999 | 734.8 | W | 769.9 | 811.0 | W | 852.1 | 841.2 | W | W | W | W | NA |
| 2000 | W | W | 784.3 | W | 810.6 | W | 810.5 | 848.5 | W | 900.5 | W | W |
| 2001 | W | 872.7 | W | W | 935.7 | W | W | W | 914.5 | 918.5 | W | 906.6 |
| 2002 | 860.5 | W | W | W | 898.3 | 919.7 | W | 833.6 | W | W | W | W |
| 2003 | 832.1 | 808.1 | W | W | 838.5 | 858.8 | 853.5 | 872.5 | W | 855.6 | 829.8 | 855.3 |
| 2004 | 852.7 | 831.0 | 823.1 | 835.5 | 911.2 | 855.9 | W | 853.1 | 845.7 | W | 854.2 | 867.5 |
| 2005 | W | 844.4 | 840.1 | 825.6 | 815.5 | 875.4 | 834.7 | 822.1 | W | 782.3 | 778.2 | 839.8 |
| 2006 | 781.1 | 769.1 | 809.3 | W | 791.2 | 810.9 | 773.1 | 739.0 | 674.2 | 742.1 | 737.4 | 758.4 |
| 2007 | 698.3 | W | W | W | 755.3 | 749.2 | 703.3 | 691.9 | W | W | 602.7 | 602.6 |
| 2008 | 572.0 | 569.0 | 562.3 | 540.0 | 531.5 | 514.2 | 465.7 | 439.6 | 461.5 | 445.8 | 447.5 | 470.4 |
| 2009 | 484.6 | 486.3 | 494.9 | 491.6 | 512.2 | W | W | W | 496.5 | W | 494.5 | W |
| 2010 | 459.7 | W | W | W | 498.1 | 503.6 | 508.5 | 484.7 | 491.5 | 496.6 | 481.4 | 490.1 |
| 2011 | 445.1 | 165.3 | 142.1 | 144.9 | 123.1 | 137.6 | 133.5 | 114.3 | 127.1 | 133.7 | 137.5 | 133.8 |
| 2012 | 123.7 | 127.4 | 129.0 | 133.2 | 132.4 | 138.6 | 134.0 | 120.1 | 138.6 | W | W | W |
| 2013 | W | W | W | W | W | W | W | W | W | W | W | W |
| 2014 | W | W | W | W | W | W | W | W | W | W | W | W |
| 2015 | W | W | W | W | W | W | W | W | W | W | W | W |
| 2016 | W | W | W | W | W | W | W | W | W | W | W | W |
| 2017 | W | W | W | W | W | W | W | W | W | - | - | - |
| 2018 | - | - | - | W | W | W | W | W | W | W | W | W |
| 2019 | - | - | - | - | - | - | - | - | - | - | - | - |
| 2020 | - | - | - | - | - | - | - | - | - | - | - | - |
| 2021 | - | - | - | - | - | - | - | - | - | - | - | - |
| 2022 | - | - | - | |||||||||
| - = No Data Reported; -- = Not Applicable; NA = Not Available; W = Withheld to avoid disclosure of individual company data. |
| Release Date: 6/1/2022 |
| Next Release Date: TBD |