|
Download Data (XLS File) |
|
||||||||
|
||||||||
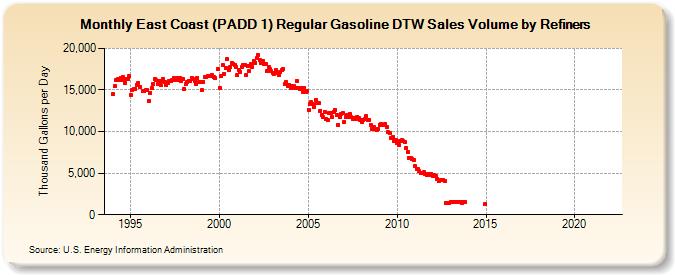
| East Coast (PADD 1) Regular Gasoline DTW Sales Volume by Refiners (Thousand Gallons per Day) | ||||||||
| Year | Jan | Feb | Mar | Apr | May | Jun | Jul | Aug | Sep | Oct | Nov | Dec |
|---|---|---|---|---|---|---|---|---|---|---|---|---|
| 1994 | 14,510.3 | 15,435.1 | 16,148.5 | 16,306.5 | 16,207.3 | 16,471.6 | 16,242.3 | 16,500.7 | 15,855.0 | 16,311.5 | 16,314.9 | 16,629.9 |
| 1995 | 14,403.5 | 15,004.4 | 15,078.3 | 15,121.4 | 15,638.1 | 15,891.3 | 15,417.1 | W | 14,862.0 | 14,890.2 | 14,968.4 | 14,989.7 |
| 1996 | 13,650.9 | 14,654.6 | 15,211.7 | 15,759.3 | 16,312.9 | 16,166.2 | 15,662.8 | 16,101.5 | 15,609.4 | 16,089.6 | 16,293.4 | 15,937.1 |
| 1997 | 15,617.8 | 15,850.7 | 16,036.0 | 16,036.1 | 16,221.2 | 16,392.7 | 16,149.0 | 16,413.8 | 16,153.4 | 16,496.0 | 16,097.2 | 16,299.2 |
| 1998 | 15,123.5 | 15,698.0 | 15,954.5 | 16,113.9 | 16,098.4 | 16,429.8 | 16,306.3 | 16,029.8 | 15,775.6 | 16,425.5 | 15,905.4 | 15,931.5 |
| 1999 | 14,982.4 | 15,987.3 | 16,507.2 | 16,521.3 | 16,646.4 | 16,639.0 | 16,664.0 | 16,742.9 | 16,546.7 | 16,419.8 | W | 17,484.2 |
| 2000 | 15,278.7 | 16,645.6 | 17,972.8 | 16,955.5 | 17,681.0 | 18,700.0 | 17,442.5 | 17,807.6 | 18,263.5 | 18,181.5 | 18,059.7 | 17,730.7 |
| 2001 | 16,793.1 | 17,459.9 | 17,182.9 | 17,799.4 | 18,058.9 | 17,963.4 | 16,837.5 | 17,863.9 | 17,224.5 | 18,135.3 | 17,790.2 | 18,532.3 |
| 2002 | 18,297.4 | 18,807.0 | 19,237.5 | 18,589.6 | 18,257.4 | 18,423.6 | 18,170.6 | 18,177.3 | 17,263.5 | 17,742.2 | 17,488.1 | 17,244.8 |
| 2003 | 17,057.5 | 16,922.4 | 17,365.7 | 17,097.9 | 16,821.3 | 17,155.7 | 17,395.6 | 17,552.7 | 15,728.1 | 15,985.7 | 15,500.2 | 15,648.3 |
| 2004 | 15,216.6 | 15,456.9 | 15,520.8 | 15,294.8 | 16,096.0 | 15,277.0 | 15,125.6 | 15,210.6 | 14,792.1 | 15,291.0 | 14,800.1 | 14,847.0 |
| 2005 | 12,641.8 | 13,354.8 | 13,518.4 | 13,286.3 | 12,997.4 | 13,739.9 | 13,376.5 | 13,460.9 | 12,524.5 | 12,022.4 | 11,775.0 | 12,405.2 |
| 2006 | 11,563.5 | 11,448.9 | 12,250.8 | 12,224.8 | 11,738.7 | 12,399.8 | 12,563.9 | 11,961.9 | 10,846.2 | 11,717.4 | 12,119.1 | 12,174.9 |
| 2007 | 11,184.4 | 11,786.8 | 11,946.1 | 11,742.3 | 12,149.6 | 11,700.6 | 11,563.8 | 11,632.8 | 11,512.0 | 11,777.8 | 11,611.5 | 11,433.3 |
| 2008 | 11,184.3 | 11,432.8 | 11,472.3 | 11,811.7 | 11,403.5 | 11,413.9 | 10,833.1 | 10,352.4 | 10,533.8 | 10,272.1 | 10,212.7 | 10,311.7 |
| 2009 | 10,830.3 | 10,930.1 | 10,845.1 | 10,812.7 | 10,935.9 | 10,578.0 | 9,913.2 | 9,842.5 | 9,235.4 | 9,369.3 | 8,906.9 | 9,025.8 |
| 2010 | 8,591.5 | 8,383.4 | 8,909.8 | 8,934.7 | 8,880.3 | 8,729.8 | 8,070.2 | 7,566.1 | 6,857.9 | 6,843.8 | 6,691.3 | 6,593.9 |
| 2011 | 5,842.9 | 5,553.8 | 5,473.4 | 5,260.6 | 4,966.4 | 5,013.2 | 5,095.6 | 4,871.9 | 4,819.9 | 4,914.2 | 4,811.5 | 4,918.3 |
| 2012 | 4,673.1 | 4,781.9 | 4,697.8 | 4,354.6 | 4,041.8 | 4,177.4 | 4,170.5 | 4,184.5 | 4,035.0 | 1,378.9 | 1,446.3 | 1,400.1 |
| 2013 | 1,528.0 | 1,473.1 | 1,471.9 | 1,475.0 | 1,538.0 | 1,548.1 | 1,533.4 | 1,508.3 | 1,434.7 | 1,504.6 | 1,528.1 | W |
| 2014 | W | W | W | W | W | W | W | W | W | W | W | 1,242.6 |
| 2015 | W | W | W | W | W | W | W | W | W | W | W | W |
| 2016 | W | W | W | W | W | W | W | W | W | W | W | W |
| 2017 | W | W | W | W | W | W | W | W | W | W | W | W |
| 2018 | W | W | W | W | W | W | W | W | W | W | W | W |
| 2019 | W | W | W | W | W | W | W | W | W | W | W | W |
| 2020 | W | W | W | W | W | W | W | W | W | W | W | W |
| 2021 | W | W | W | W | W | W | W | W | W | W | W | W |
| 2022 | W | W | W | |||||||||
| - = No Data Reported; -- = Not Applicable; NA = Not Available; W = Withheld to avoid disclosure of individual company data. |
| Release Date: 6/1/2022 |
| Next Release Date: TBD |